Money
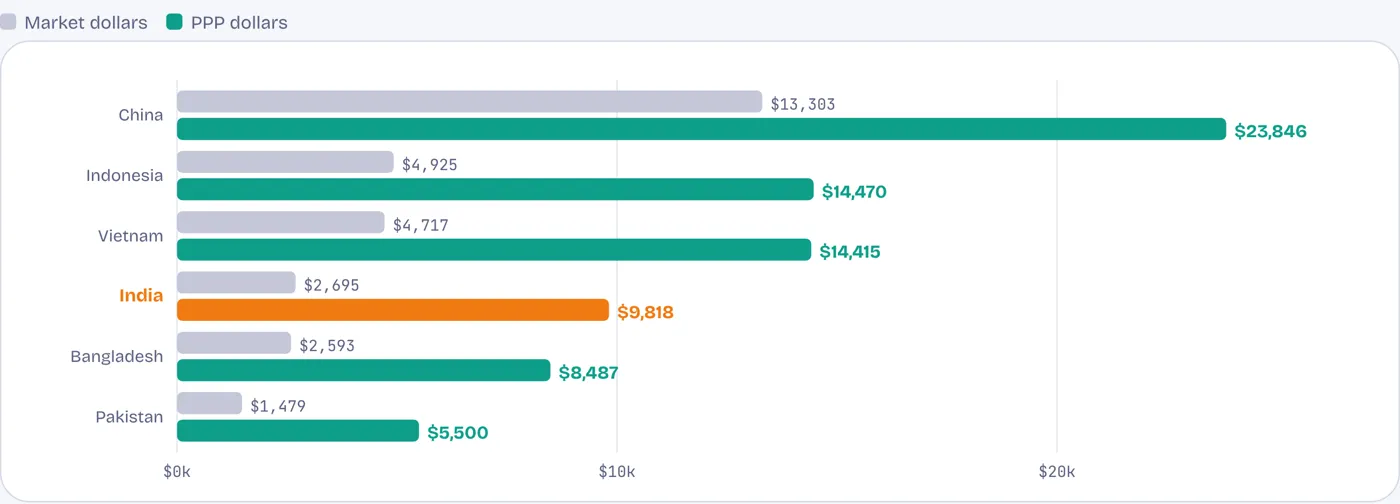
A rupee buys about four times as much in India as its dollar value suggests
Income per person, 2024: at market exchange rates (current US$) and at purchasing-power parity (PPP, constant 2021 international $). Tap or hover a bar.
Market dollars measure what an economy is worth to the rest of the world; they decide rankings by size. PPP dollars adjust for the fact that a haircut, a meal or rent costs far less in Delhi than in Dallas, so they measure living standards better. Comparisons of living standards use PPP; comparisons of economic size and trade use market dollars. The gap is why India can be the fifth-largest economy and still poor per person.
Source: World Bank WDI, 2024.
Whose numbers
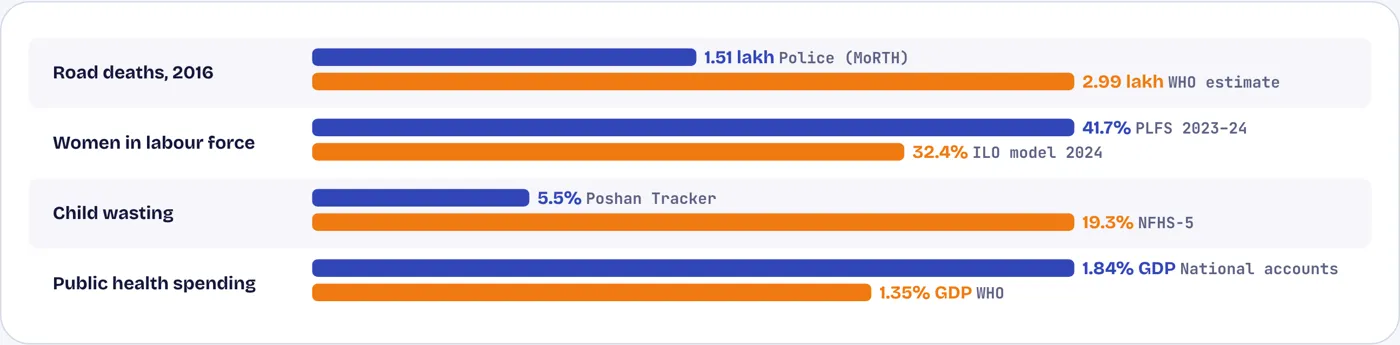
When two counts disagree, both are shown
Examples of an Indian official figure beside an international or independent estimate of the same thing
Official Indian data and international estimates often differ because they measure differently: police records against hospital-based models of road deaths, a national survey that counts unpaid farm help as work against an ILO model that standardises across countries. Neither is automatically right. Where they diverge, both appear, with the reason they differ, in a “contested numbers” box.
Source: MoRTH and WHO; MoSPI PLFS and ILO; Poshan Tracker and NFHS-5; National Health Accounts and WHO.
Indian units
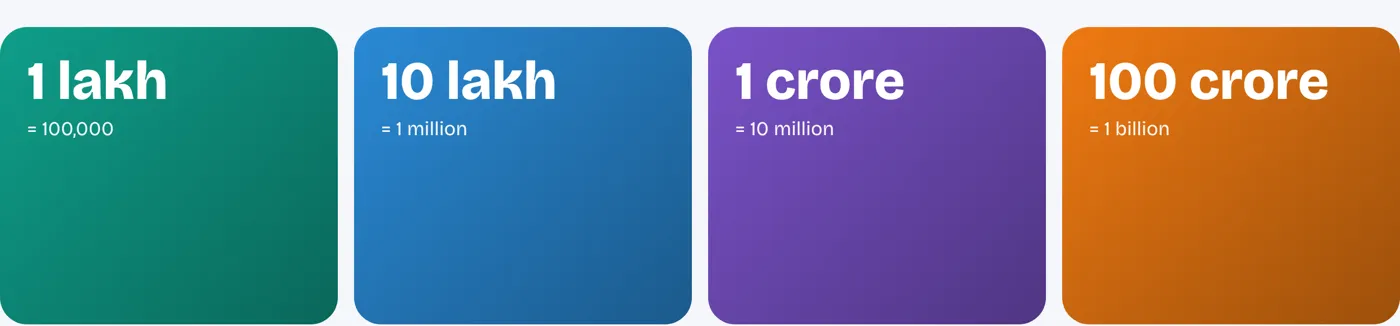
Lakh and crore
Indian figures are given in lakh and crore, as Indian readers use them; international figures in thousands, millions and billions. Rupee sums are converted to dollars only when comparing with other countries.