In 2004 a government campaigned on “India Shining” and lost. Twenty years later the economy it promised is real: twelfth in the world then, fifth now.
The climb
From 12th to 5th, with two stumbles on the way
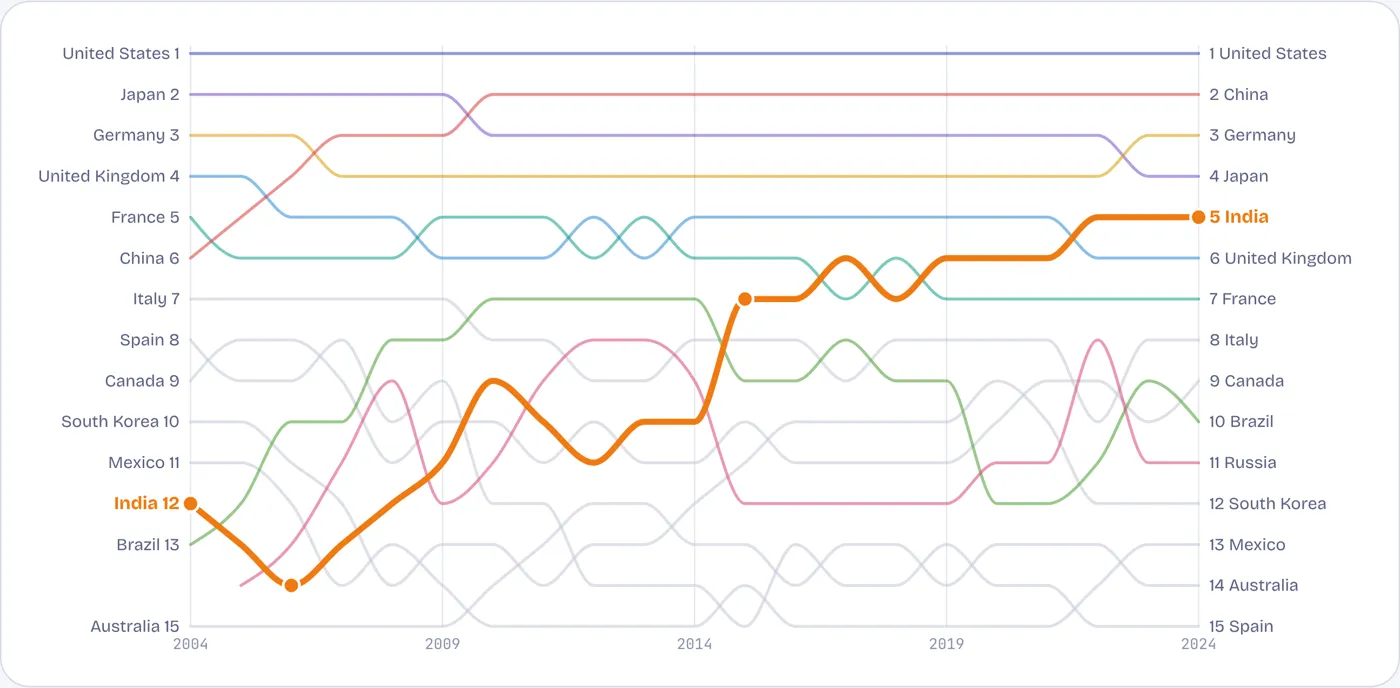
Rank among the world’s economies by GDP in current US dollars, 2004–2024. Hover or tap a line.
India slipped to 14th in 2006, when commodity exporters boomed, and lost ground again in the 2012–13 rupee slide. The biggest jump came in 2015, from 10th to 7th, as oil prices collapsed and shrank Russia, Brazil and Canada in dollar terms. The top of the table is now crowded. Germany, Japan, India and Britain all sit near $4 trillion, so small currency moves reorder them.
Source: World Bank, World Development Indicators, May 2026 release.
Weight in the world
India’s slice of world output more than doubled
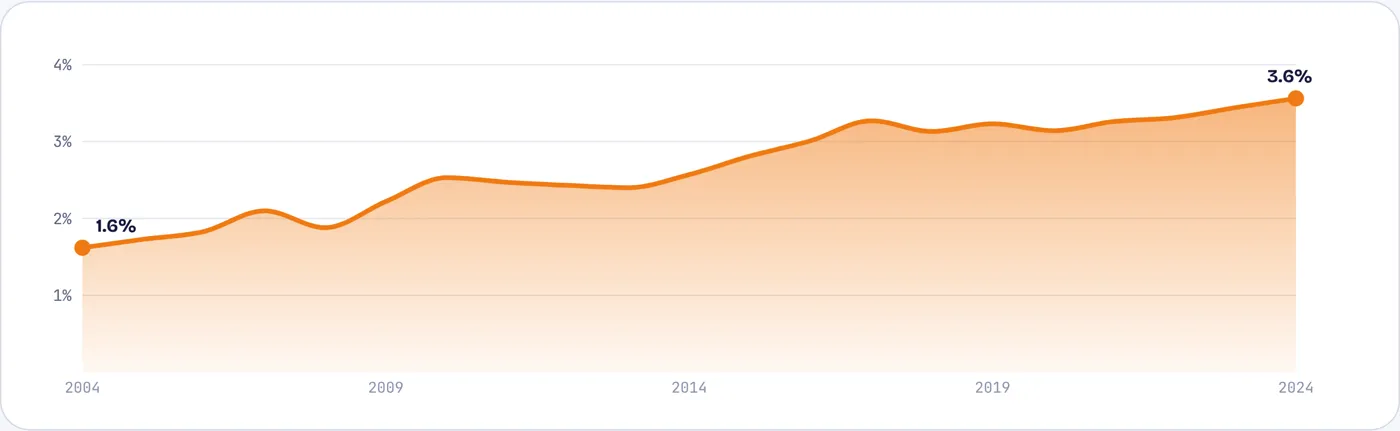
India’s GDP as a share of world GDP, current US dollars
One dollar in every 62 earned on the planet was earned in India in 2004. By 2024 it was one in 28.
Source: World Bank WDI; world total is the sum of countries reporting.
Two decades compared
Two decades, two governments, almost the same pace
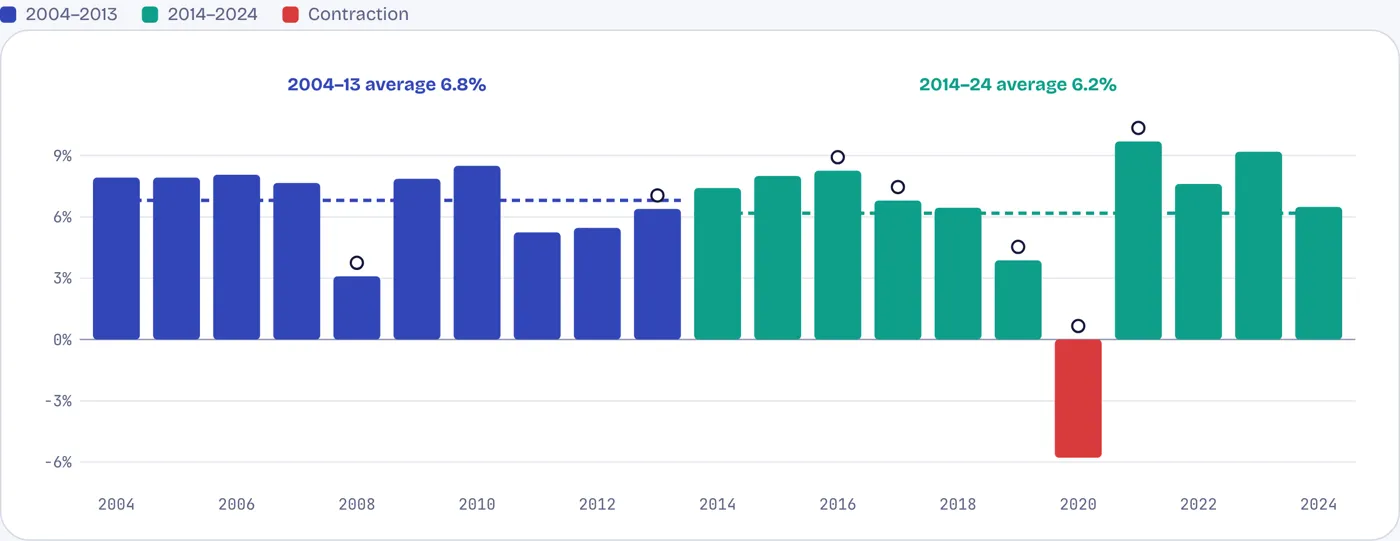
Real GDP growth by calendar year, with each decade’s average. Dots mark turning points; tap or hover for detail.
Growth averaged 6.8% a year in 2004–13 and 6.2% in 2014–24. Leave out the pandemic year and the decades are almost identical. Each had one shock and several years above 8%.
Source: World Bank WDI. Calendar years; India’s official accounts use April–March fiscal years.
Four yardsticks
“Five times larger” depends on the ruler
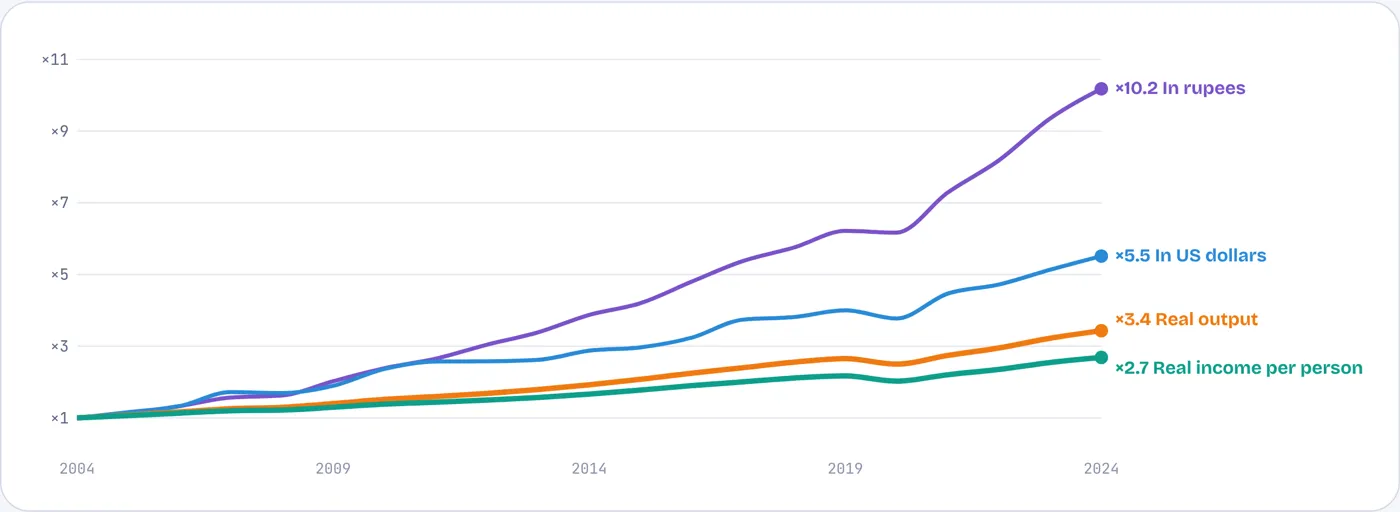
Growth since 2004 on four measures (2004 = 1)
In rupees the economy is ten times larger, mostly because prices tripled. In dollars it is 5.5 times larger. In real output, the measure of how much more India actually produces, it is 3.4 times larger. Per person the gain is 2.7 times, because 315 million people were added along the way. That is the number a household feels.
Source: World Bank WDI. Real output and real income per person in constant 2021 international dollars (PPP).
Against the peer panel
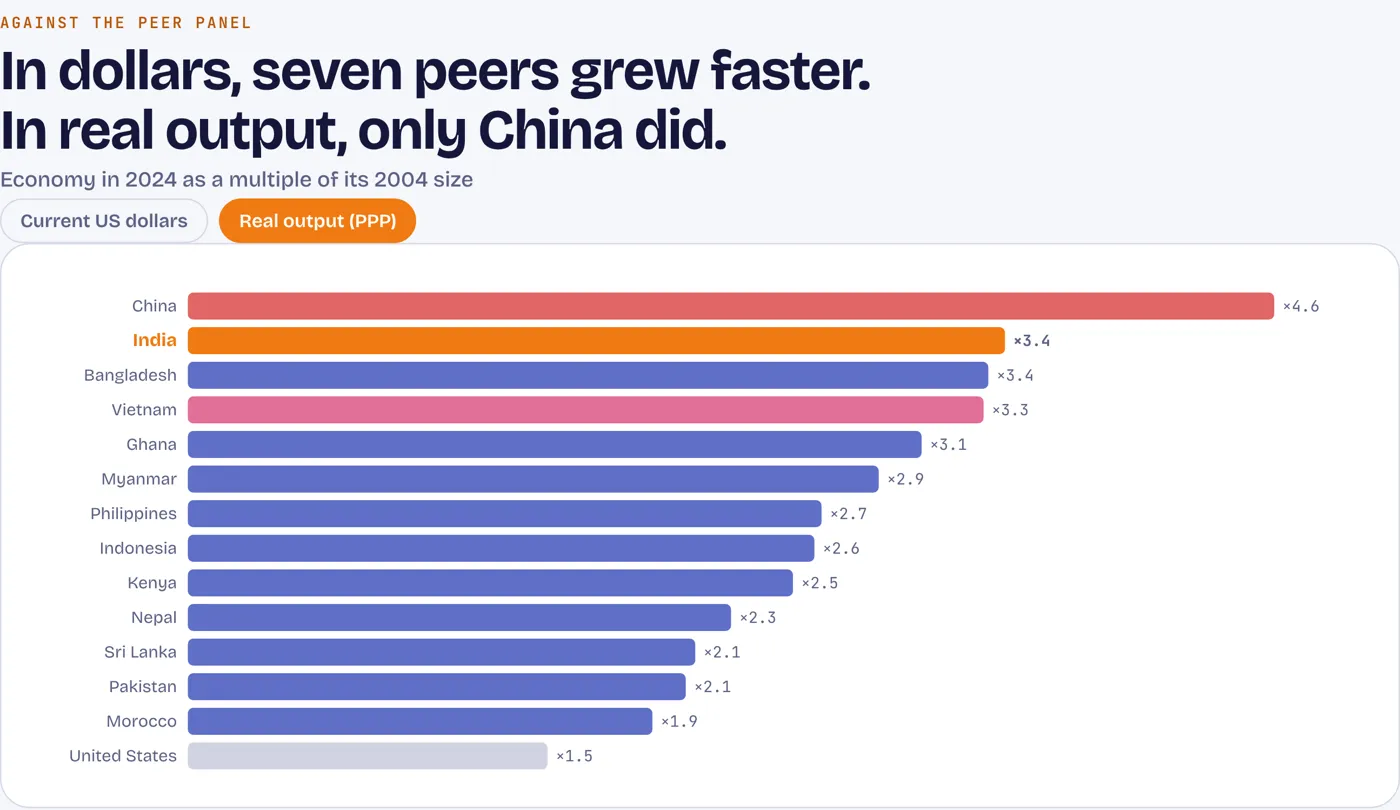
Economy in 2024 as a multiple of its 2004 size
Dollar comparisons flatter countries whose currencies held up or whose prices rose fast. Strip those effects out and India’s economy grew 3.4 times, second only to China among the peer panel and ahead of Vietnam and Bangladesh. The peer panel is the eight countries closest to India’s development profile in 2004, plus Vietnam, China and three neighbours, with the United States as a yardstick.
Source: World Bank WDI. Real output is GDP at constant 2021 international dollars.
Income per person
Sixth fastest of 105 countries in income growth per person
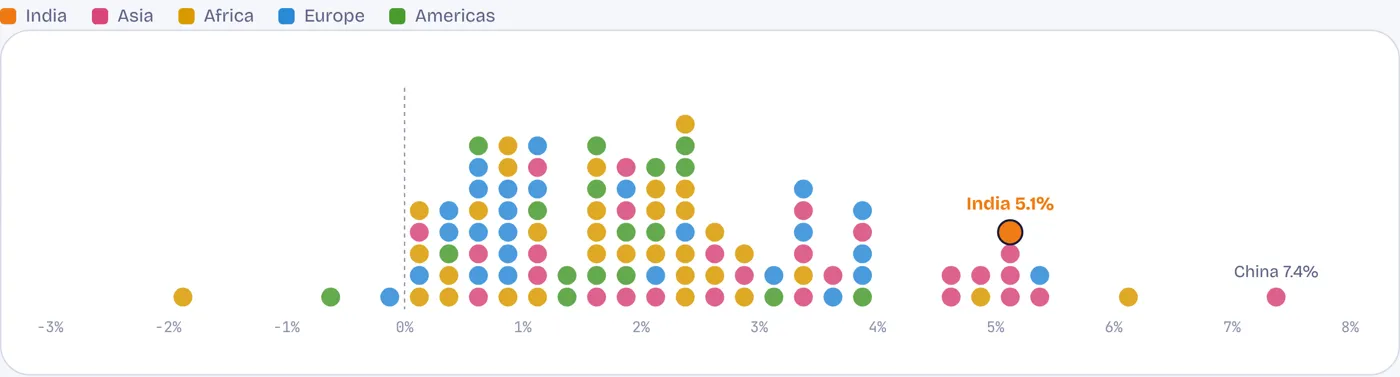
Average yearly growth in real income per person, 2004–2024, countries with 5 million+ people. Each dot is a country; tap or hover for names.
India’s 5.1% a year places it in a small leading group with China, Ethiopia, Cambodia, Azerbaijan, Bangladesh and Vietnam. Most of the world grew at 1–3%.
Source: World Bank WDI; GDP per person at constant 2021 international dollars.
Where the growth came from
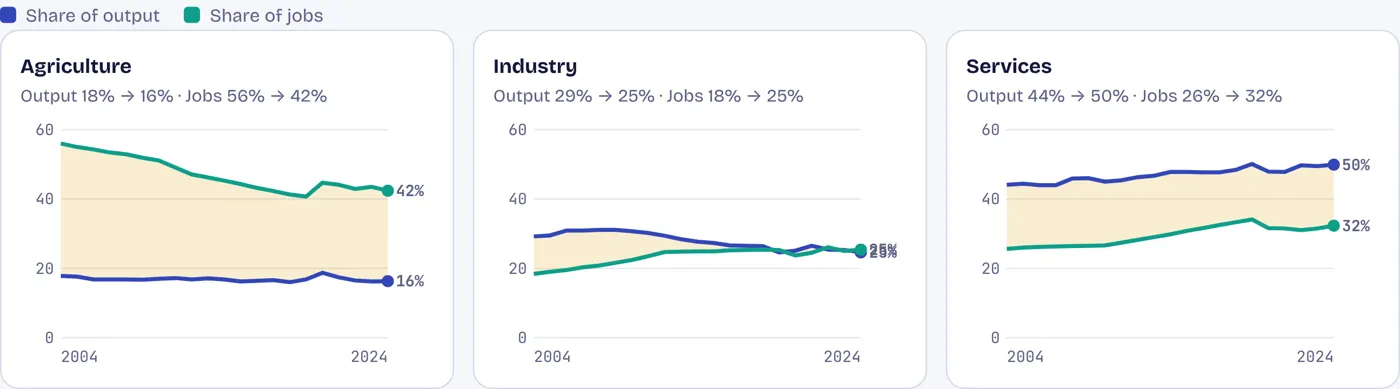
Farms still hold 42% of jobs but make 16% of output
Each sector’s share of output and of jobs, 2004–2024
Fourteen points of the workforce left agriculture. They went mostly into construction and informal services, not into factories. Industry’s share of output fell from 29% to 25%. Services produce half of output but employ a third of workers. That is the opposite of the farm-to-factory route that lifted China, Vietnam and Bangladesh.
Source: World Bank WDI; jobs are ILO modelled estimates. Output shares exclude net taxes on products.
The machinery underneath
Steadier prices and a deep cushion of reserves
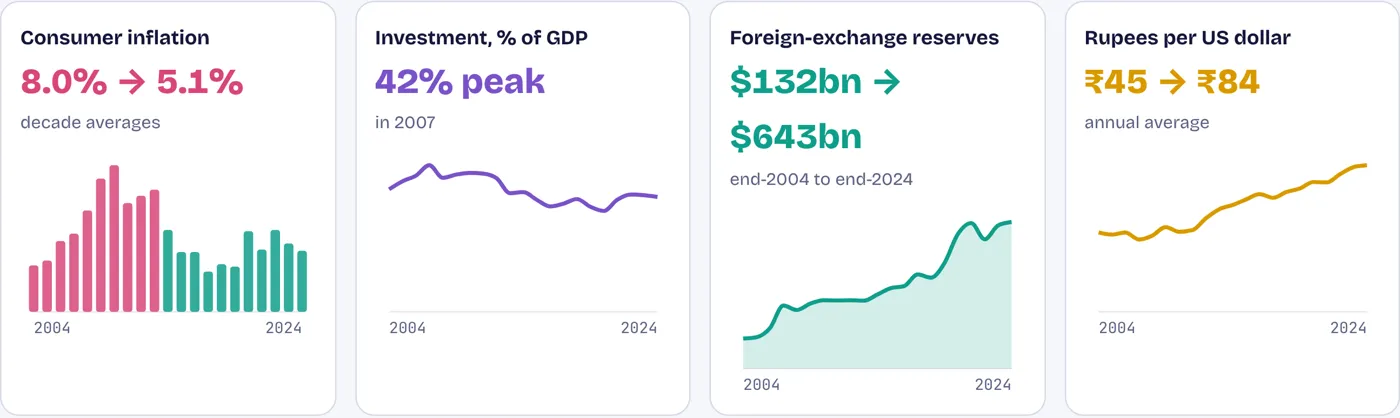
Four indicators, 2004–2024
Inflation averaged 8.0% in 2004–13 and 5.1% in 2014–24, helped by an inflation target adopted in 2016. Reserves rose almost fivefold, which is why a rupee that fell from ₹45 to ₹84 per dollar never turned into a 1991-style crisis. Investment peaked at 42% of GDP in 2007 and has not returned there.
Source: World Bank WDI. Reserves include gold; inflation is consumer prices.
Contested numbers
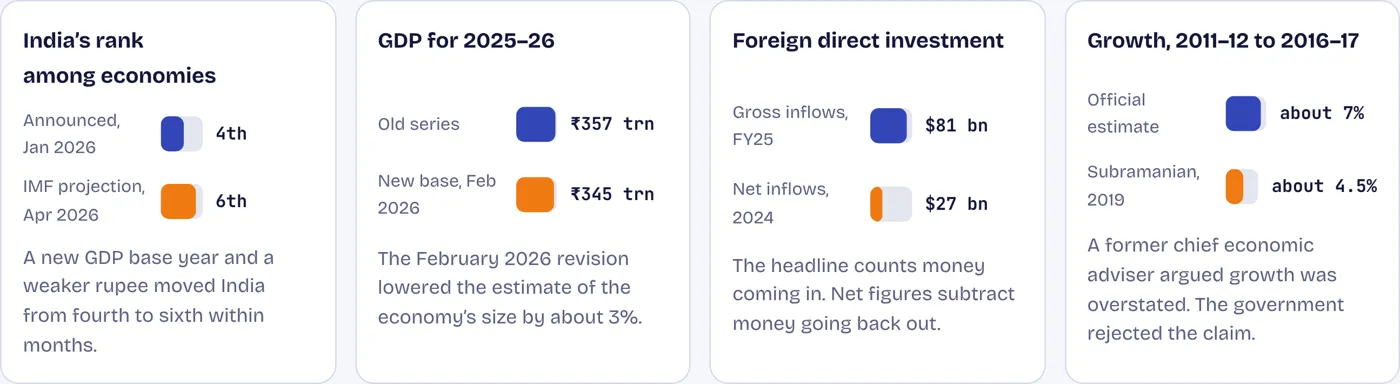
Four numbers that depend on who is counting
Source: government announcement (Jan 2026); IMF World Economic Outlook (Apr 2026) and February 2026 GDP base revision, as reported by The Indian Express; DPIIT gross FDI for FY2024–25; World Bank net FDI for calendar 2024; Arvind Subramanian, Harvard CID (2019).
The other ledger
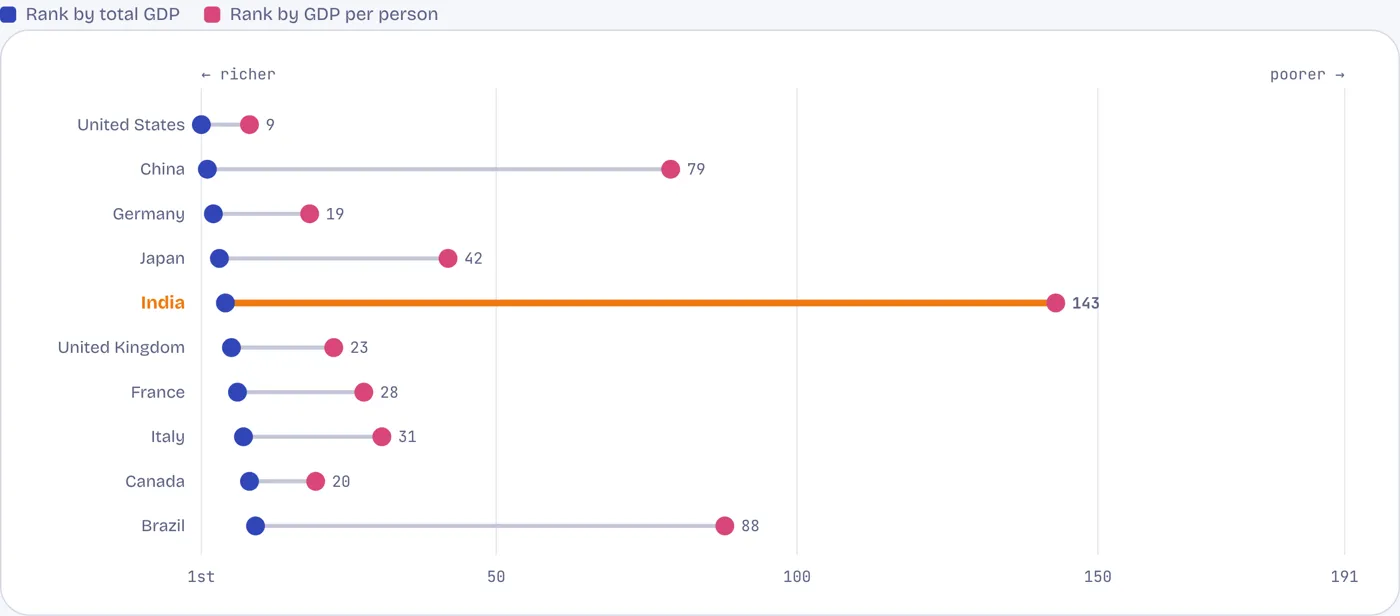
Fifth by the size of its economy, 143rd by the income of its people
The ten largest economies in 2024: rank by total GDP and rank by GDP per person, among 191 countries
No other large economy shows a gap like India’s. China ranks 79th per person and Brazil 88th. India, at $2,695 a head, sits beside Bangladesh and Cambodia.
Source: World Bank WDI, GDP and GDP per person in current US dollars, 2024.