In 2011 a poverty line of ₹32 a day caused uproar in Parliament. Since then the number of Indians below the world’s extreme-poverty line has fallen by more than a quarter of a billion.
Four measures
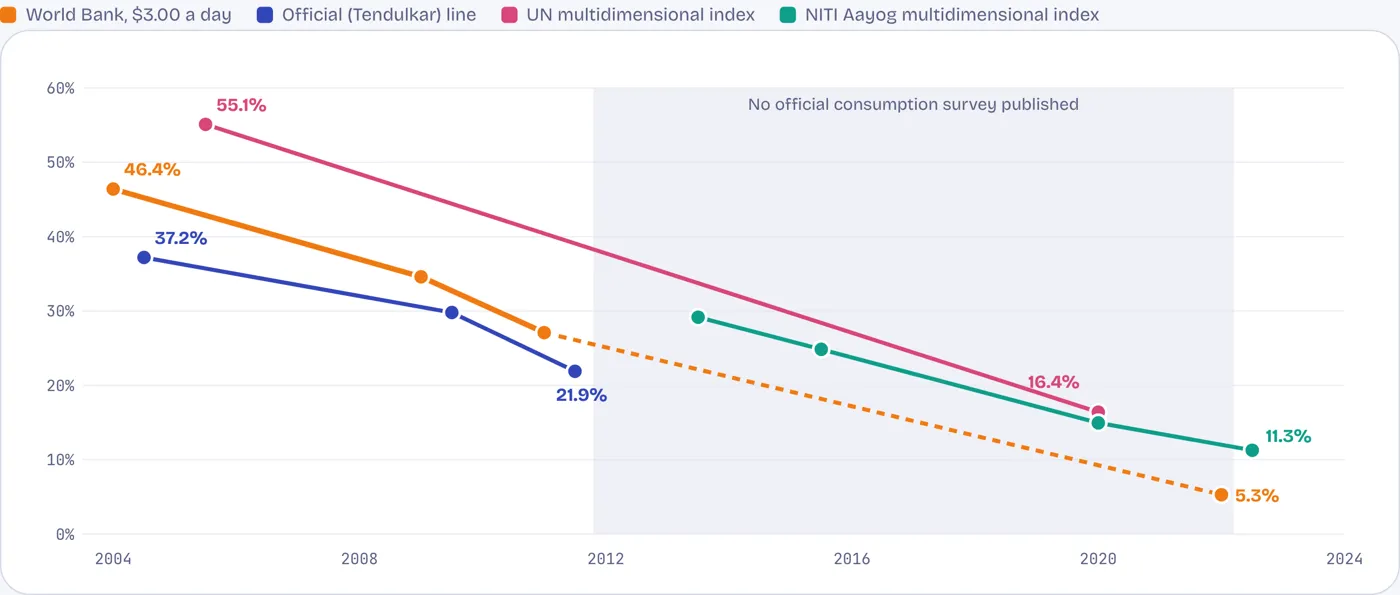
Every measure of poverty points the same way
Share of Indians counted as poor on four measures. Tap or hover any point; the shaded years had no published consumption survey.
Two measures count money, two count living conditions such as schooling, nutrition, cooking fuel, sanitation and housing. They were built by different bodies, Indian and international, and disagree on levels. None disagrees on direction.
Source: World Bank WDI (May 2026); Planning Commission via WDI; UNDP/OPHI Global MPI 2023; NITI Aayog MPI 2023 and 2024.
People, not percentages
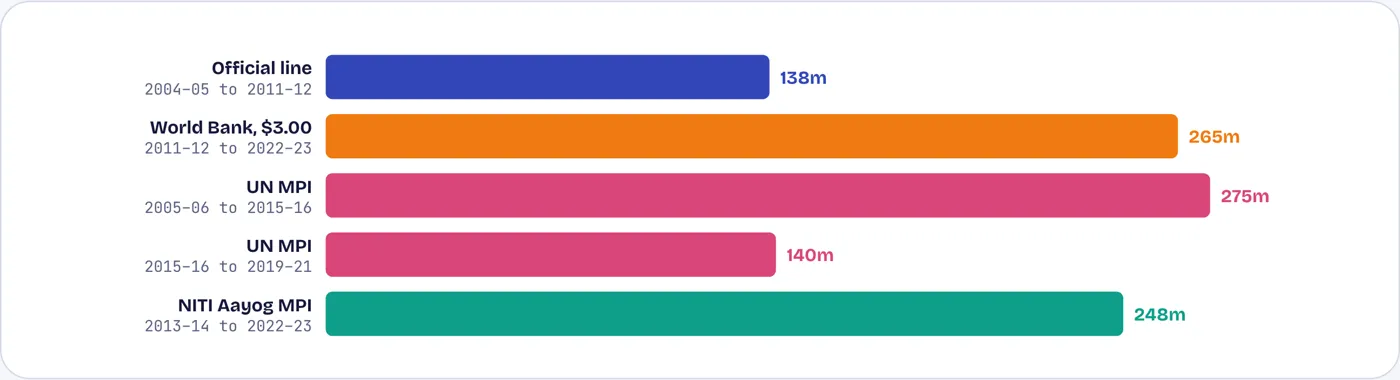
Hundreds of millions left poverty on every count
Reduction in the number of poor people, by measure and period
The periods differ, so the bars cannot be added. Each is a separate witness. The largest, the UN’s 415 million over fifteen years, is the biggest fall in poverty recorded anywhere in that time.
Source: Planning Commission (2013); World Bank poverty update (June 2025); UNDP/OPHI Global MPI 2023; NITI Aayog MPI discussion paper (January 2024).
Two decades compared
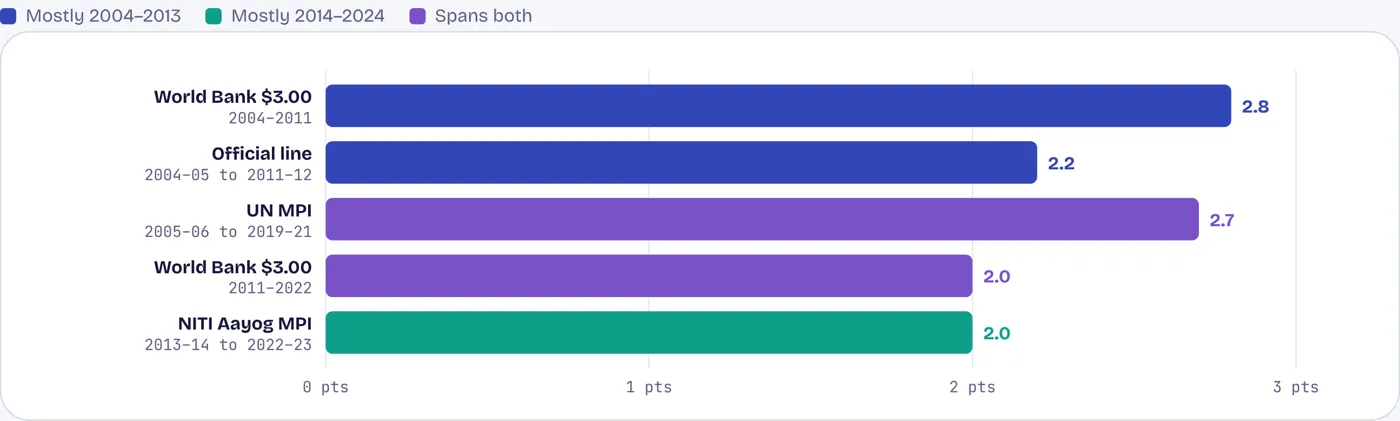
Both decades cut poverty fast
Fall in the poverty rate, percentage points a year, by measure and period
In points, poverty fell slightly faster in the first decade, when there was more of it to cut. As a share of what remained, it fell faster in the second: extreme poverty shrank about 7% a year in 2004–11 and about 14% a year in 2011–22. Neither government owns the whole achievement.
Source: Author’s calculations from the sources above. Survey years rounded to the first calendar year.
The missing decade
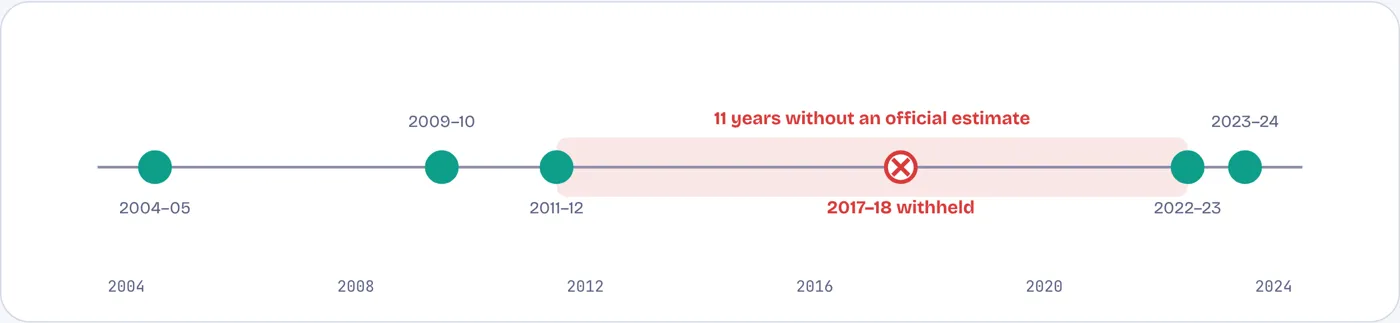
Eleven years without an official poverty count
India’s national consumption surveys, the basis of every money-based poverty estimate
The 2017–18 survey was completed and approved for release in June 2019, then withheld in November 2019 over “data quality issues”. A reported draft showed real spending per person down 3.7% since 2011–12, which would have been the first fall in more than forty years. The 2022–23 survey used a new design. It is widely judged better, but comparison with 2011–12 is imperfect.
Source: Ministry of Statistics announcement, 15 November 2019, and Business Standard report of the draft, via Business Today; MoSPI HCES press notes.
What households spend
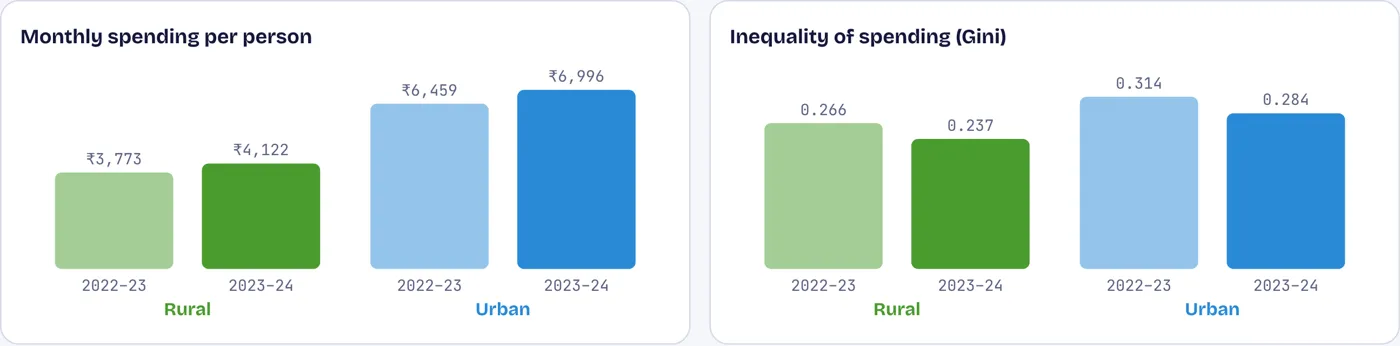
A city dweller spends 70% more than a villager
Average monthly spending per person, current rupees, and the spread of spending (Gini index), latest two surveys
Measured spending grew 9% in villages and 8% in cities in a single year, and became more evenly spread. Surveys miss most of the very rich, so they show less inequality than income and tax records do.
Source: MoSPI, Household Consumption Expenditure Survey 2023–24 press note, December 2024. Excludes the value of free items from welfare schemes.
Higher lines
Out of destitution, not yet out of poverty
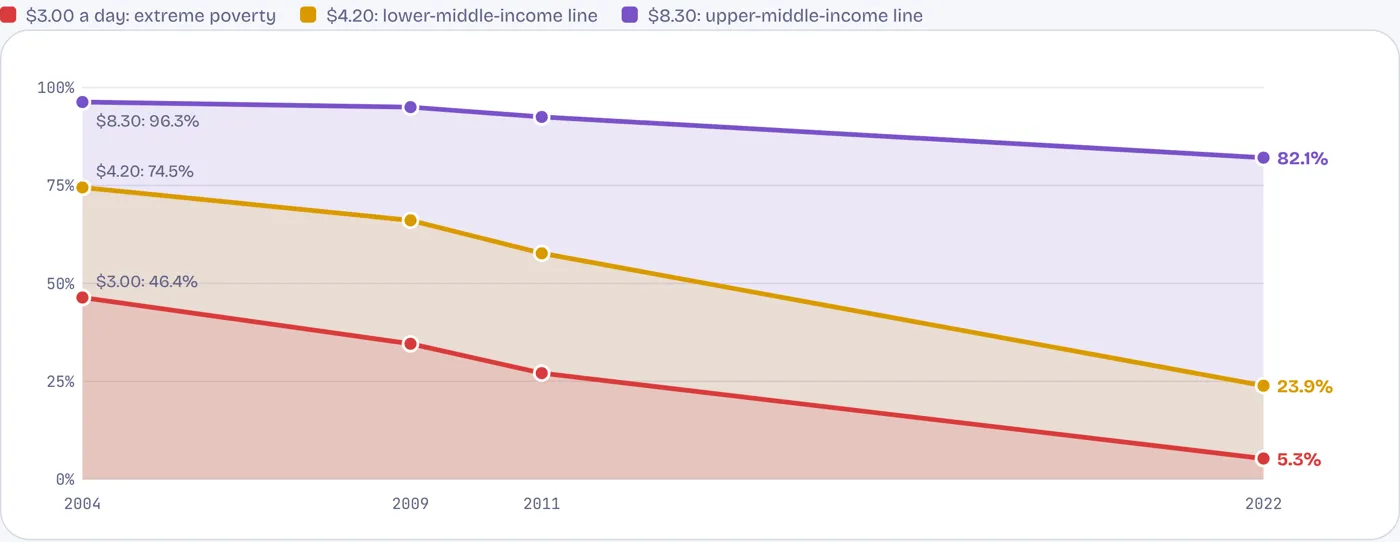
Share of Indians below three World Bank poverty lines (2021 prices)
The fall at $4.20, from 74.5% to 23.9%, is even larger than at the extreme line. But the $8.30 line, typical of countries like Indonesia or Brazil, barely moved until the last decade. In 2022, 82.1% of Indians still lived below it.
Source: World Bank WDI (May 2026). Survey years 2004, 2009, 2011 and 2022.
A hundred Indians
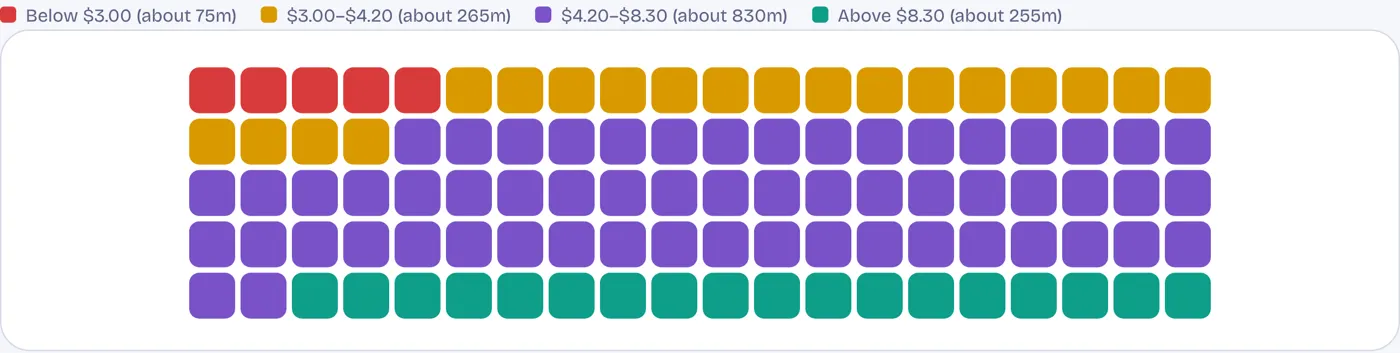
Of every 100 Indians, 82 live below $8.30 a day
India’s population in 2022 by daily consumption band, each square one percent
Most of the people who left extreme poverty are still close to it. A failed harvest, a hospital bill or a lost job can push them back.
Source: World Bank WDI shares applied to a 2022 population of 1.425 billion. Bands rounded to whole percentages.
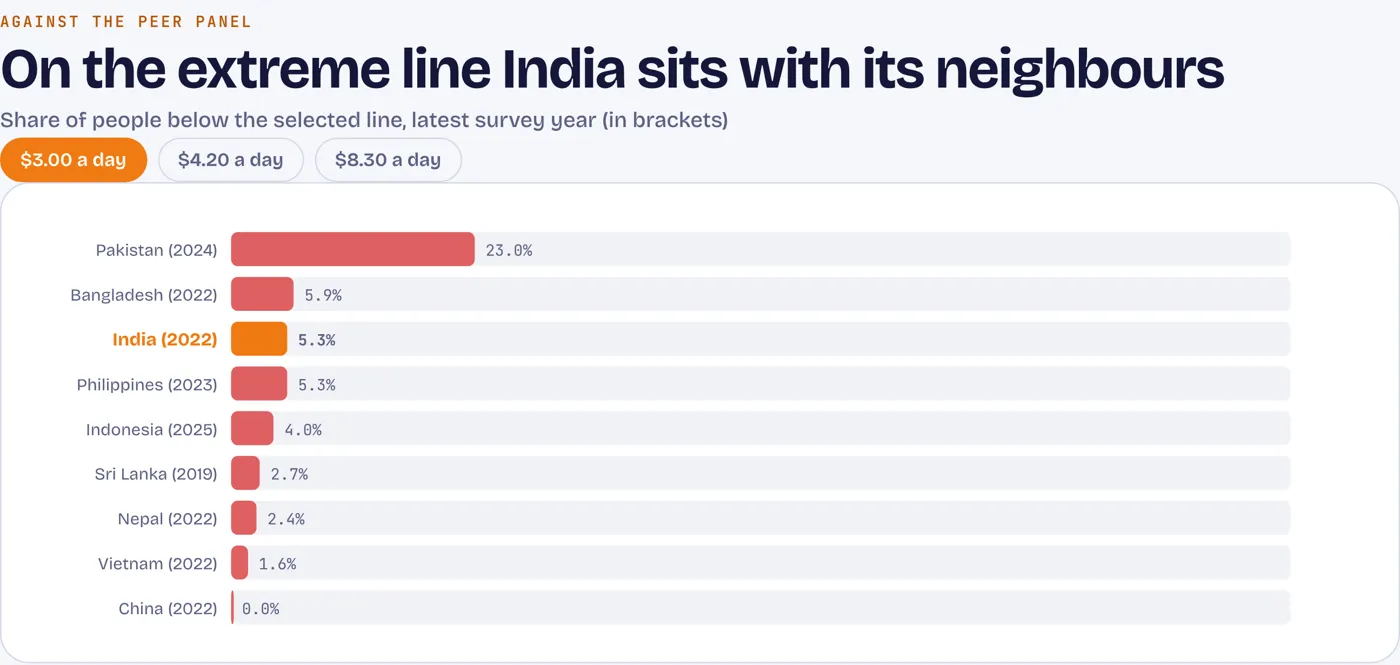
Against the peer panel
Share of people below the selected line, latest survey year (in brackets)
Source: World Bank WDI (May 2026). Survey years differ by country.
What made it happen
Growth did most of the work; the state put a floor underneath
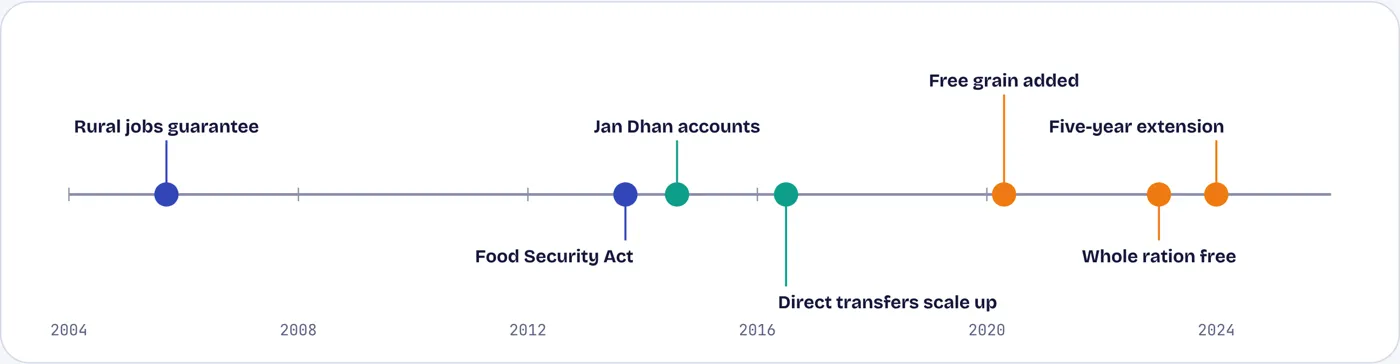
Policies that bear directly on poverty, 2004–2026. Tap or hover a marker.
Income per person rose 2.7 times and farm jobs fell from 56% to 42% of all work. On top of that came a rural jobs guarantee, subsidised and then free grain, bank accounts and basic services. Free rations for about 80 crore people are a welfare achievement, and a measure of how many Indians still cannot be left to feed themselves.
Source: National Rural Employment Guarantee Act 2005; National Food Security Act 2013; PMGKAY extension (Outlook Business, November 2023); World Bank WDI.
Contested numbers
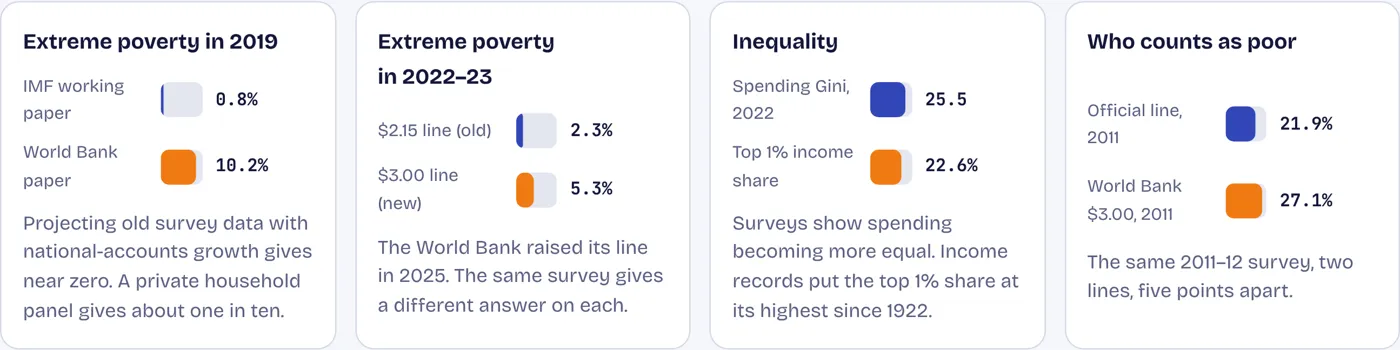
How poor is India now? It depends on the method
Source: Bhalla, Virmani and Bhasin, IMF Working Paper (April 2022); World Bank estimate for 2019 (April 2022), as reported by Scroll; World Bank poverty update (June 2025); World Inequality Lab (March 2024); World Bank WDI.
The other ledger
Fewer poor, but 102nd of 123 on hunger
Global Hunger Index 2025 rank, South Asia (lower is better)
Sri Lanka, Nepal and Bangladesh all rank well ahead of India. About one child in five under five is wasted, too thin for their height, a share that has barely moved across three national health surveys.
Source: Global Hunger Index 2025; NFHS-5 (2019–21).