In 2004 one Indian child in thirteen died before turning five. Today it is one in thirty-eight. No other number in two decades of growth measures as directly what a country has given its people.
The fall
India cut child deaths by two-thirds and passed Bangladesh
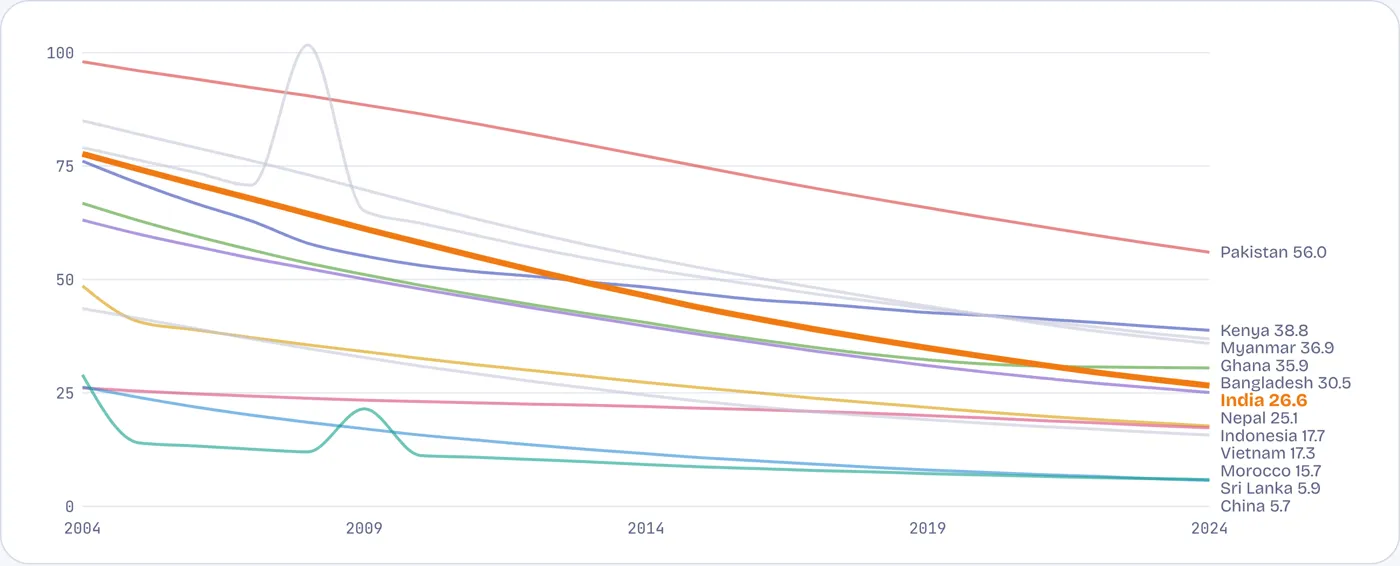
Under-5 deaths per 1,000 live births, India and the peer panel. Tap or hover a line to pick out a country.
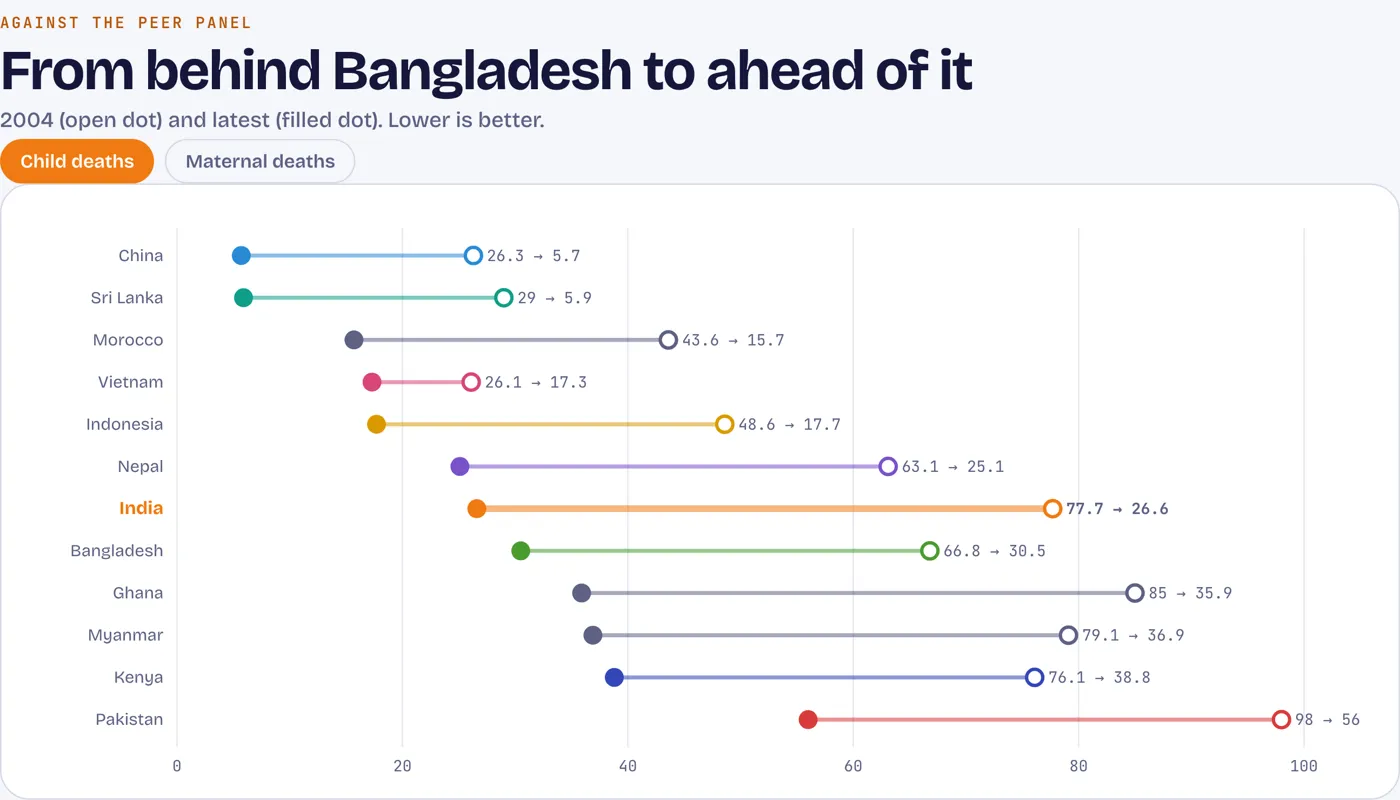
India started the period behind Bangladesh, Nepal and Indonesia. It finished ahead of Bangladesh, level with Nepal, and still behind Indonesia, Sri Lanka, China and Vietnam. China and Vietnam were already at India’s current rate in 2004.
Source: World Bank WDI (UN Inter-agency Group for Child Mortality Estimation), May 2026 release.
Lives
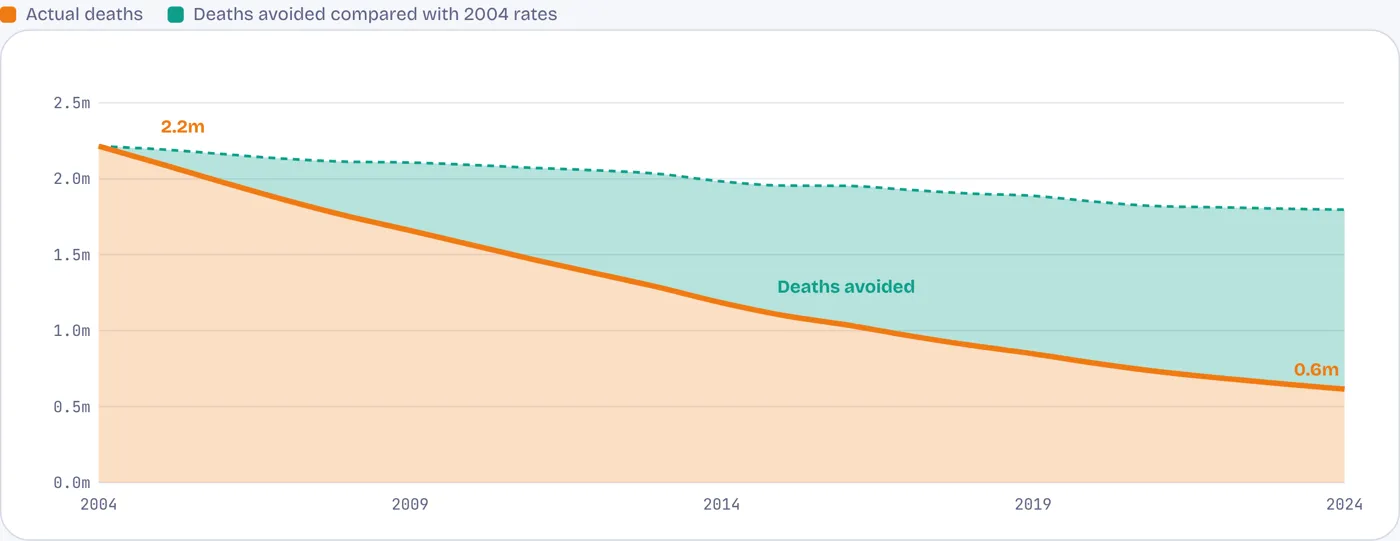
About 15 million children alive who would have died at 2004 rates
Children dying before age five each year, India. The shaded band shows deaths that would have occurred had the 2004 rate held.
Annual under-5 deaths fell from 2.2 million to about 615,000. Fewer births explain part of that. The rest is survival: applying 2004 death rates to the children actually born from 2005 to 2024 gives about 15 million more deaths than occurred.
Source: World Bank WDI; deaths avoided are the author’s estimate from births (crude birth rate × population) and the change in under-5 mortality.
Where deaths remain
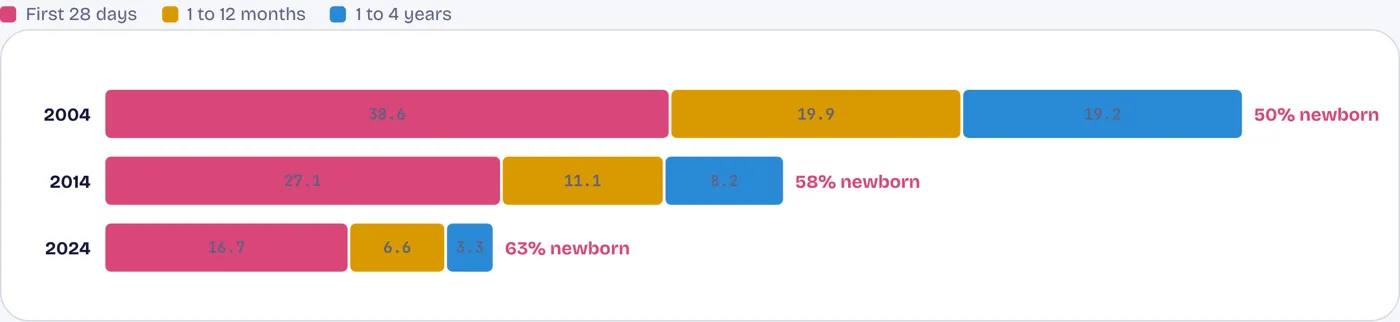
Nearly two of every three child deaths now happen in the first month
Under-5 deaths per 1,000 births, split by age at death
Deaths after the first year fell by 83%, the gain from vaccines, clean water and oral rehydration. Deaths in the first month fell by 57%. The remaining deaths need neonatal care units, skilled birth attendants and warm, clean delivery rooms: harder and costlier to build.
Source: World Bank WDI (UN IGME). Neonatal, infant and under-5 mortality rates.
Births and mothers
Births moved into hospitals and maternal deaths fell by three-quarters
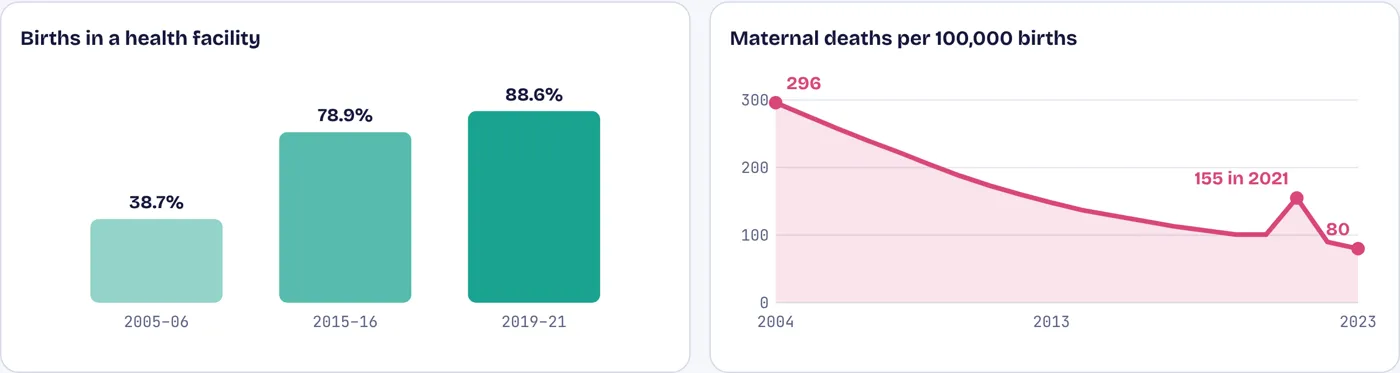
Hospital and clinic births (national surveys) and maternal deaths per 100,000 live births
Nine in ten births now happen in a health facility, up from fewer than four in ten in 2005–06. Cash payments to mothers who give birth in a facility, launched in 2005, helped drive the shift. Maternal deaths fell from 296 to 80 per 100,000 births, with a sharp pandemic spike in 2021.
Source: National Family Health Surveys 3, 4 and 5; World Bank WDI (UN Maternal Mortality Estimation Inter-agency Group).
Vaccines
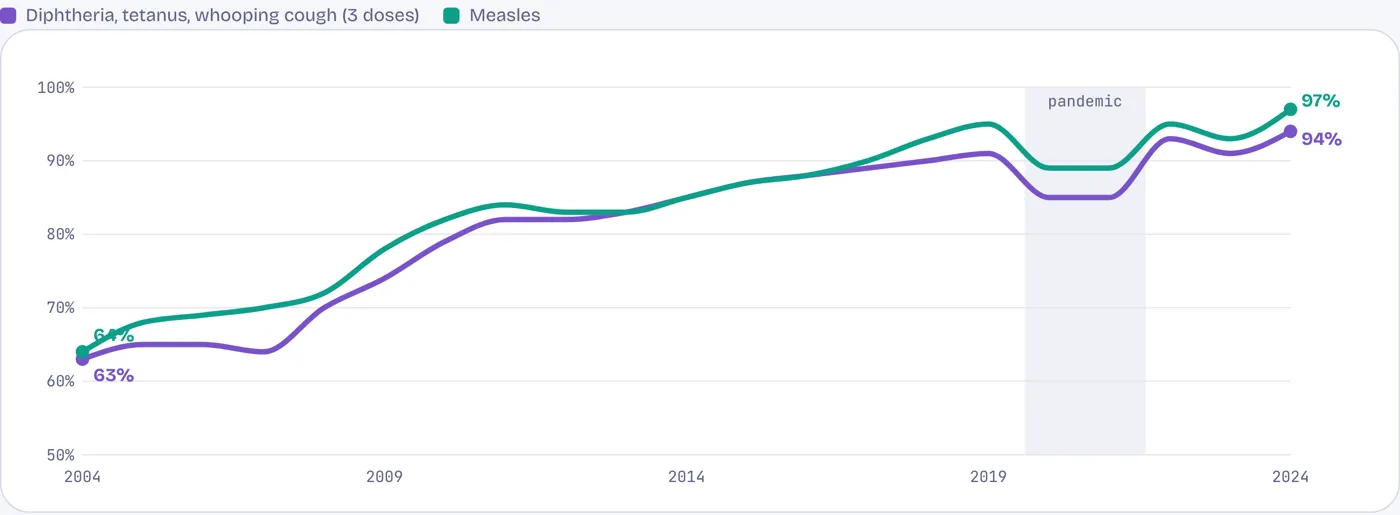
Vaccine coverage rose from under two-thirds to near-universal
Share of children aged 12–23 months vaccinated, India
Coverage climbed steadily through both decades, dipped in the pandemic, and reached 94% and 97% by 2024. A catch-up drive from 2014 targeted districts where children had been missed.
Source: World Bank WDI (WHO/UNICEF estimates of national immunisation coverage).
Against the peer panel
2004 (open dot) and latest (filled dot). Lower is better.
Source: World Bank WDI (UN IGME and MMEIG estimates). Child deaths per 1,000 births, 2004–2024; maternal deaths per 100,000 births, 2004–2023.
Life expectancy
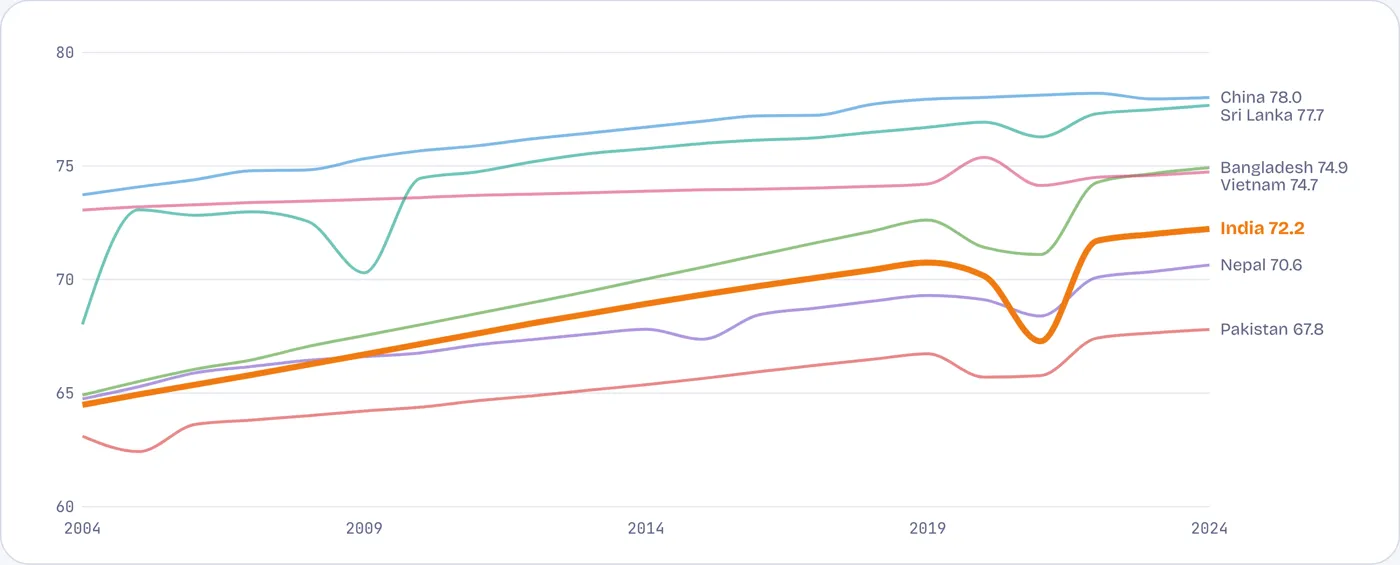
Eight more years of life, but Bangladesh still lives longer
Life expectancy at birth, years. Tap or hover a line.
Indians born in 2024 can expect to live to 72, up from 64.5. The pandemic took more than three years off in 2021, the deepest fall among the peer panel, before a full recovery. Bangladesh, level with India in 2004, now lives 2.7 years longer.
Source: World Bank WDI (UN World Population Prospects).
What made it happen
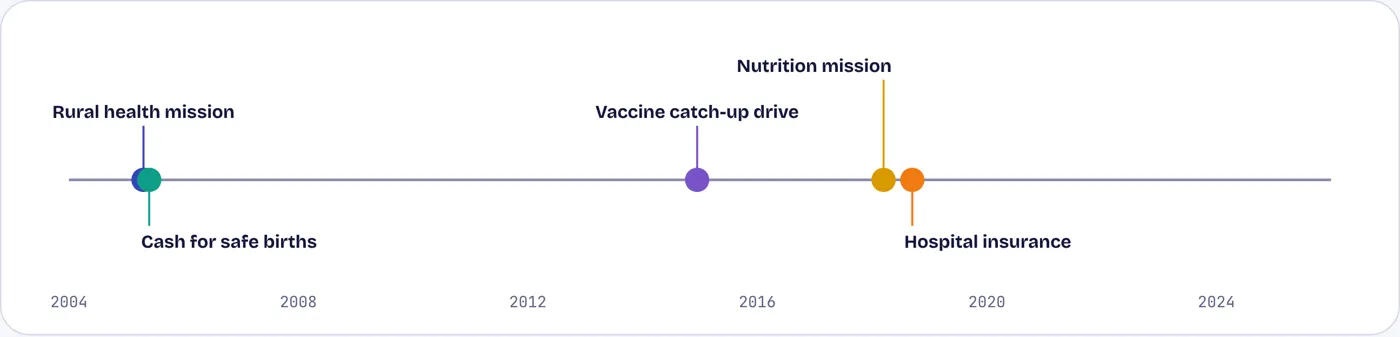
A rural health mission, cash for safe births, a vaccine drive
Programmes behind the fall in child and maternal deaths. Tap or hover a marker.
Most of these programmes rebuilt the public primary-health system that poor families use. Falling poverty, more educated mothers, toilets and clean cooking fuel helped from outside the health system.
Source: Ministry of Health and Family Welfare programme launches.
Contested numbers
Where the counts agree, and where they do not
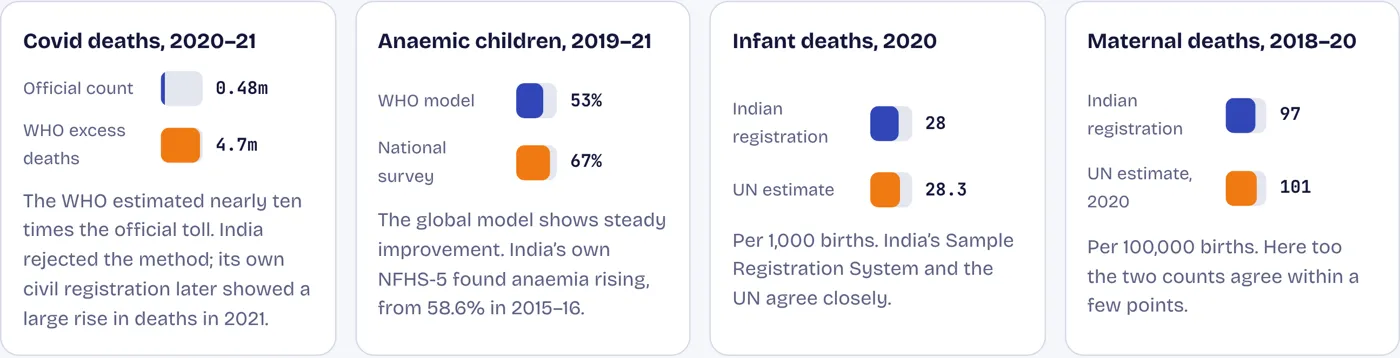
Source: Sample Registration System bulletins; World Bank WDI (UN estimates); WHO global excess-mortality estimates (May 2022); NFHS-5; WHO modelled anaemia estimates via WDI.
The other ledger
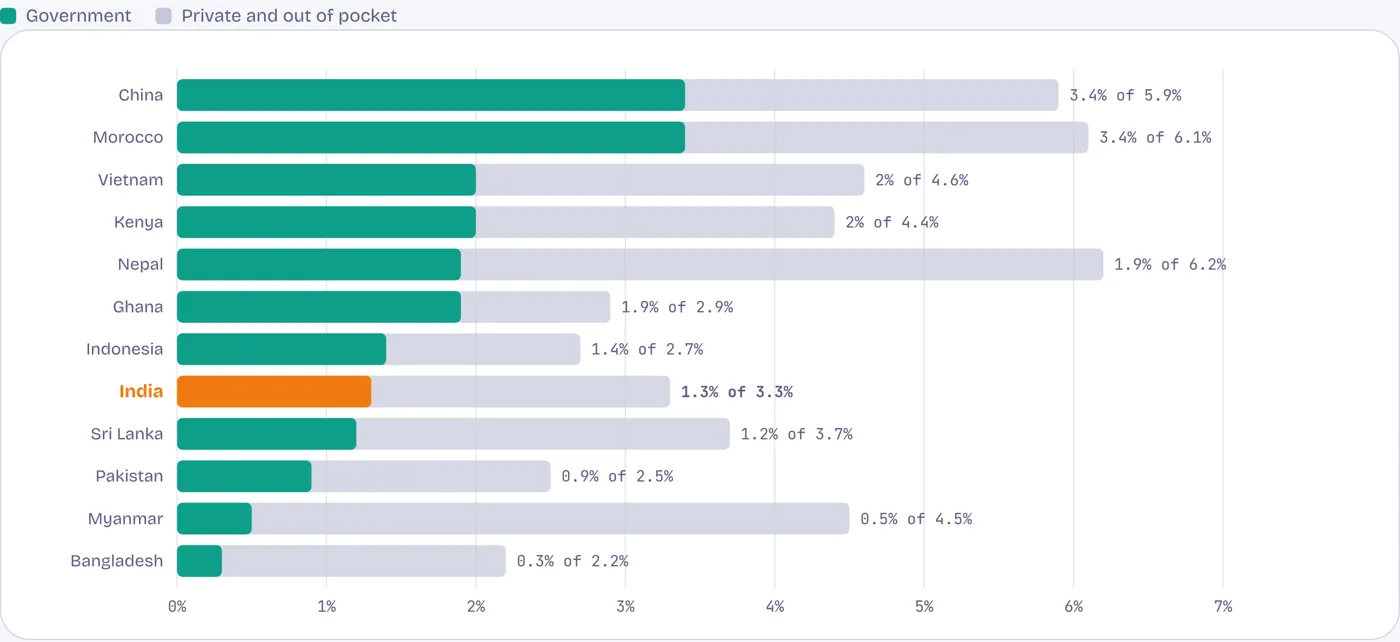
Government still spends just 1.3% of GDP on health
Health spending as a share of GDP: government and total, latest year (2023). Tap or tap or hover for the out-of-pocket share.
India’s government spends 1.3% of GDP on health, against 3.4% in China and Morocco and 2.0% in Vietnam and Kenya. Out-of-pocket payments have fallen from 72% to 44% of all health spending, yet total health spending shrank as a share of the economy.
Source: World Bank WDI (WHO Global Health Expenditure Database).