From the home
Two homes in three send their wastewater into open drains, soak pits or nowhere
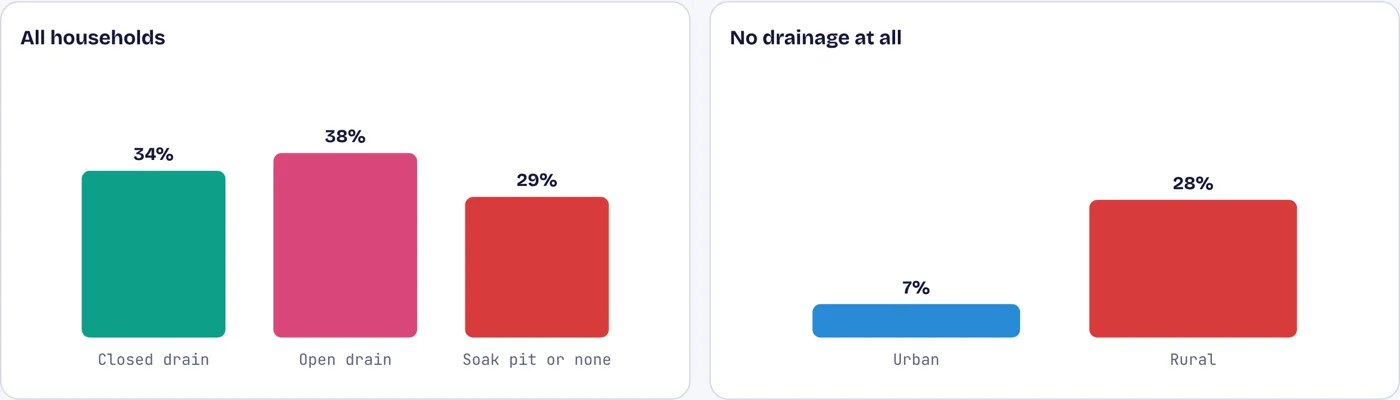
Where households’ wastewater goes, % of households, 2019–21
Only 34% of Indian homes are connected to a closed drain. Another 38% let kitchen, bath and toilet water run into open drains that flow past homes and into streams. In villages, 28% of households have no drainage at all. Toilets are only one source: most household wastewater is greywater from washing and cooking, and it goes wherever the drain does.
Source: NFHS-5 (2019–21), analysed in Jain et al. (2024), via India Water Portal. The remainder includes soak pits and households with no drainage.
The pipes
Fewer than one litre in five of household wastewater flows into a sewer
Domestic wastewater generated, by the system that receives it, %
Septic tanks receive more than half of India’s domestic wastewater; sewers receive 18%. A septic tank is safe only if it is sealed and emptied into a treatment plant. Many are emptied by private tankers into fields and drains, and the overflow of many more runs into the street drain.
Source: WHO and UN-Habitat, SDG 6 data portal, India country profile.
The plants
Cities generate 72,000 million litres of sewage a day and treat 20,000
Urban sewage and treatment, million litres a day (MLD), 2020 national inventory
Treatment plants were built for 44% of urban sewage; plants actually running could handle 37%; and the volume that reached them and was treated was 28%. The rest, about 52,000 million litres a day, went untreated into rivers, lakes, the sea and the ground. Some plants run below capacity because the sewer lines to feed them were never laid.
Source: CPCB national inventory of sewage treatment plants (2021), via Lok Sabha reply.
Among nations
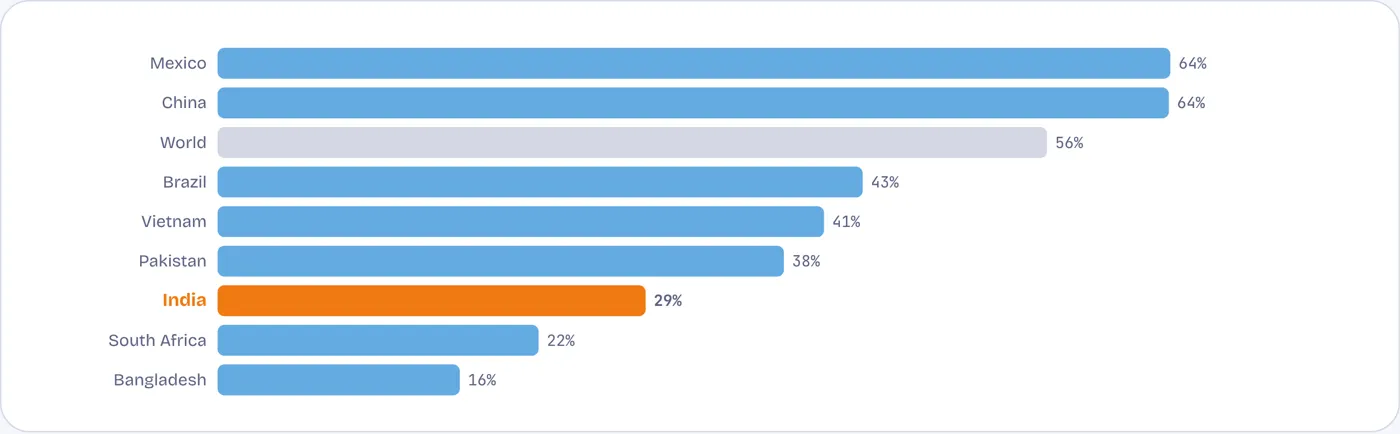
India treats a smaller share of household wastewater than China, Vietnam or Pakistan
Domestic wastewater flows safely treated, %, latest year (2022–24)
India safely treats 29% of its domestic wastewater, about the South Asian average and half the world’s 56%. China and Mexico treat two-thirds. India does not report the share of industrial wastewater safely treated at all.
Source: WHO and UN-Habitat, SDG indicator 6.3.1, SDG 6 data portal.
The factories
Industrial effluent is tracked river by river, not nationally
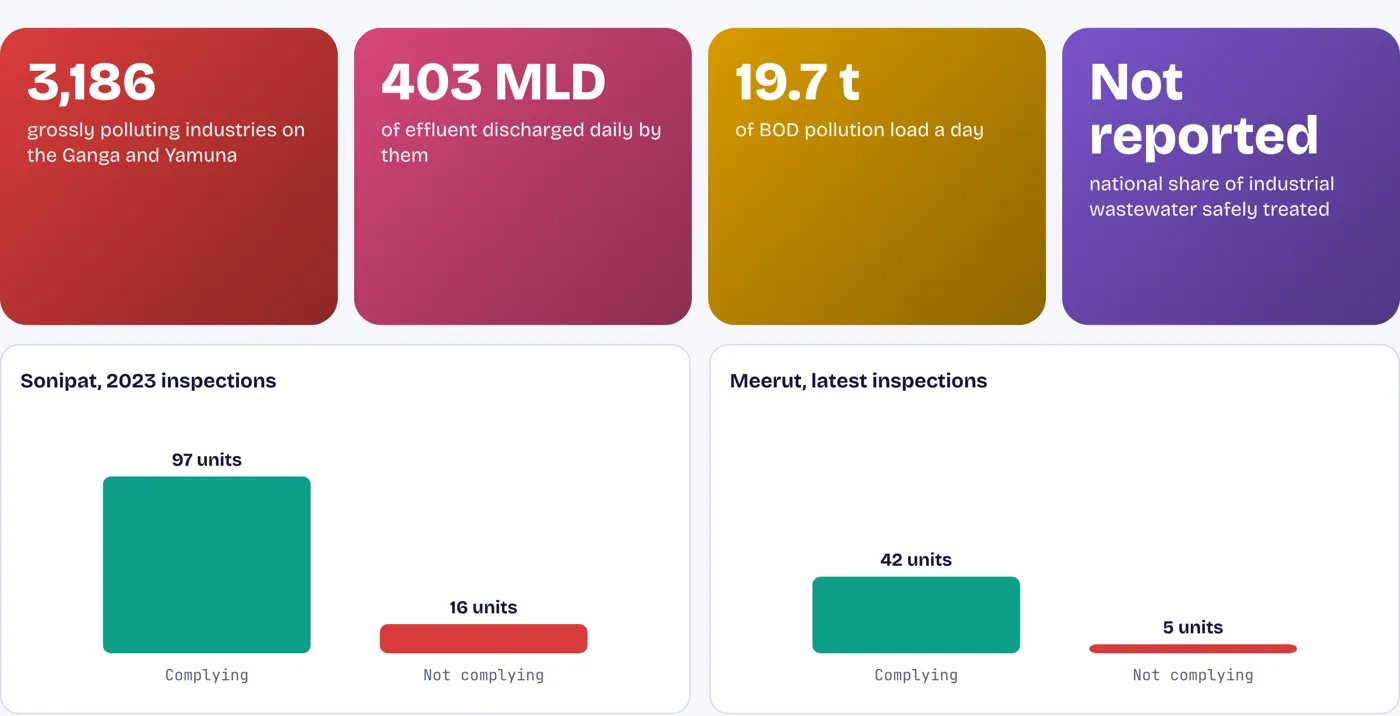
Grossly polluting industries on the Ganga and Yamuna, and recent inspection results
India has no published national figure for how much industrial wastewater is generated or treated. What exists is river by river: 3,186 grossly polluting industries on the Ganga and Yamuna discharge about 403 million litres of effluent a day. Inspections find most units compliant, but one in seven failed in Sonipat in 2023; the notices issued were withdrawn after later inspections found the units compliant.
Source: Ministry of Jal Shakti, Lok Sabha replies (AU436; AU207, 3 February 2025; AU1613, 5 December 2024); SDG 6 data portal.
The result
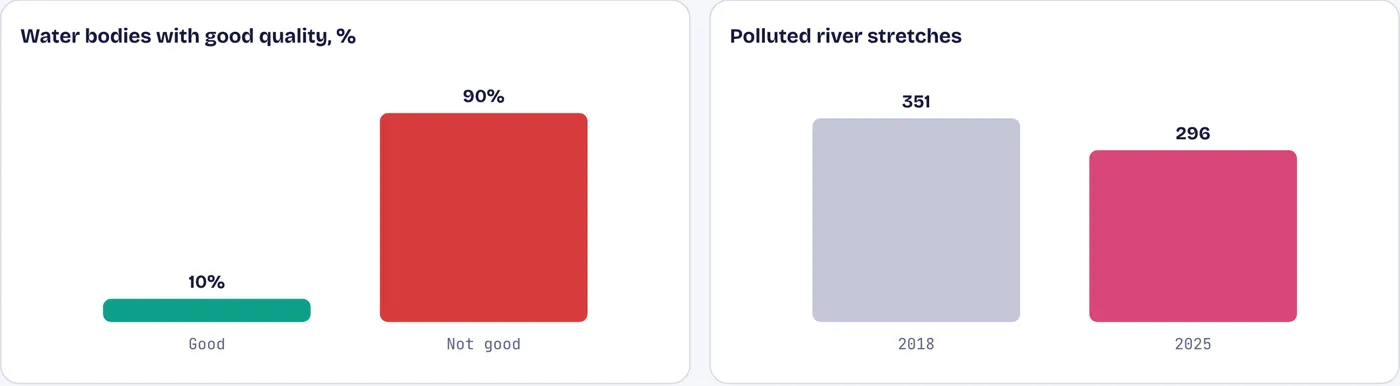
Only one water body in ten that India monitors has good water quality
Share of monitored water bodies with good ambient water quality, 2023; polluted river stretches
Untreated sewage and effluent end up in the rivers and lakes that supply drinking water downstream. India reports good ambient quality in just 10% of the water bodies it monitors. The count of polluted river stretches has fallen, from 351 in 2018 to 296 in 2025, but most remain.
Source: SDG indicator 6.3.2 via SDG 6 data portal; CPCB polluted river stretches (2018, 2025).
Who cleans
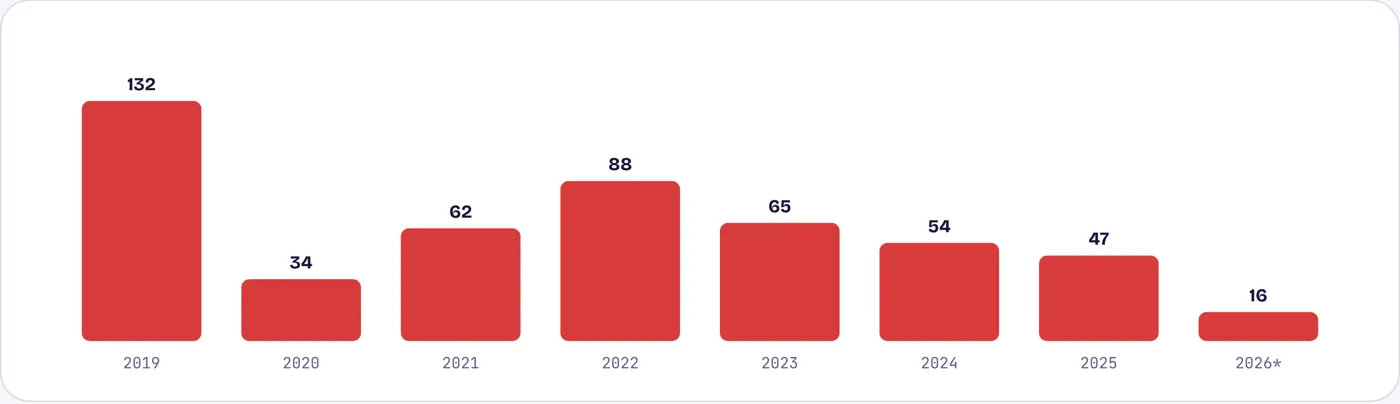
Nearly 500 workers died cleaning sewers and septic tanks since 2019
Deaths while cleaning sewers and septic tanks, by year (2026: January–June)
Where sewers and tanks are badly built and maintained, people are sent in to clear them by hand. Manual scavenging has been banned since 1993, yet 498 people died entering sewers and septic tanks between January 2019 and June 2026. The NAMASTE scheme has so far validated about 90,000 sanitation workers for safety gear, training and insurance.
Source: National Commission for Safai Karamcharis, Lok Sabha reply, via Business Standard (5 August 2026).
Contested numbers
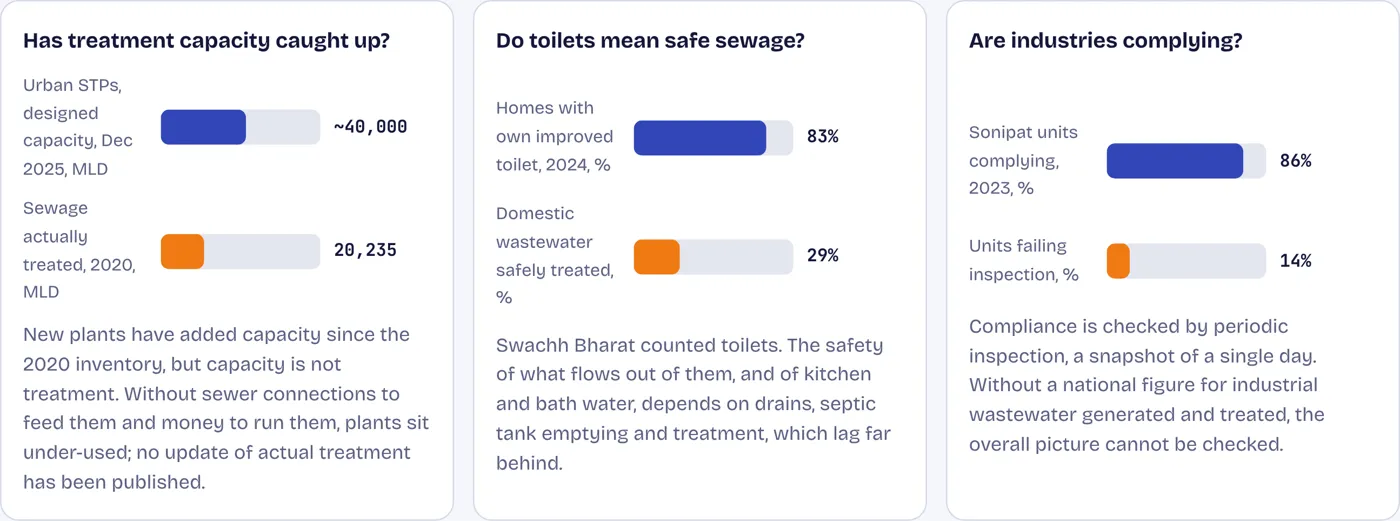
Three numbers that need a second look
Source: CPCB; Swachh Bharat Mission (Urban) via Indian Infrastructure; SDG 6 data portal.