India built highways three times as fast, electrified almost its whole rail network, more than doubled its airports and quadrupled its metro lines in a decade.
The highway machine
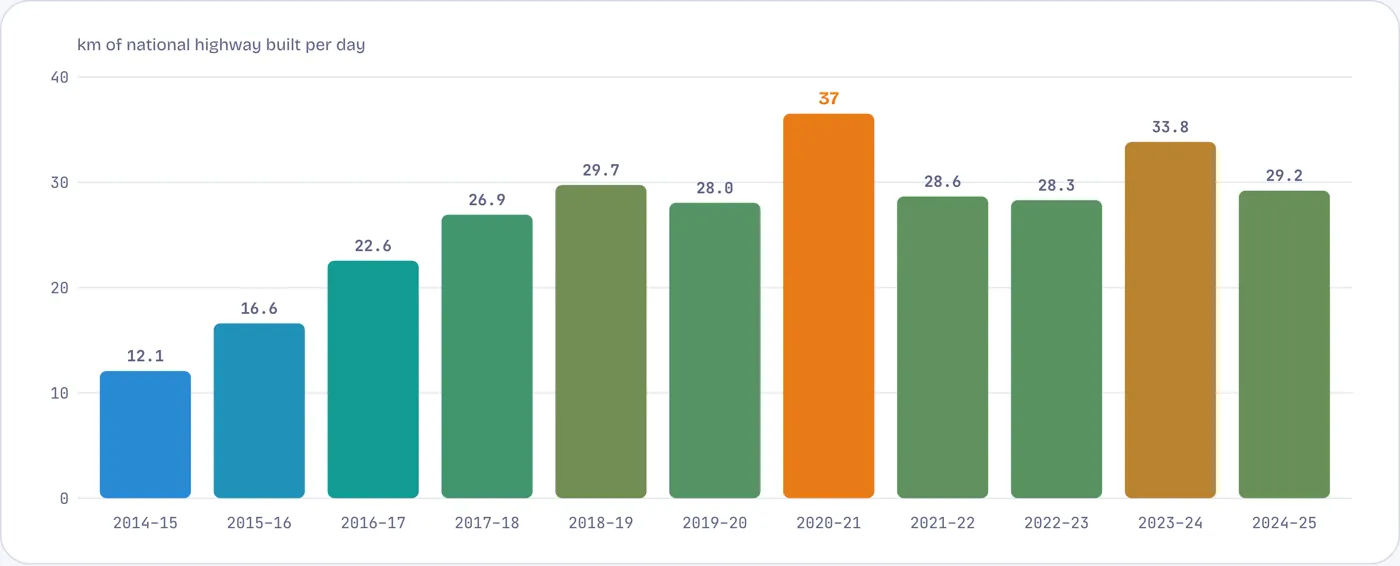
Highway building tripled in pace, then settled near 30 km a day
National highways built each financial year, km per day. Tap or hover a bar for the total.
The pace rose every year to 2018–19, dipped, and peaked at 37 km a day in 2020–21. It has since averaged about 30 km a day, well short of the ministry’s stated ambitions of 60 and 100 km a day.
Source: Ministry of Road Transport and Highways via Deccan Herald (2019–20 to 2022–23), Business Today (2014–15, 2020–21, 2023–24) and The Tribune (2024–25); earlier years from ministry annual reports.
The network
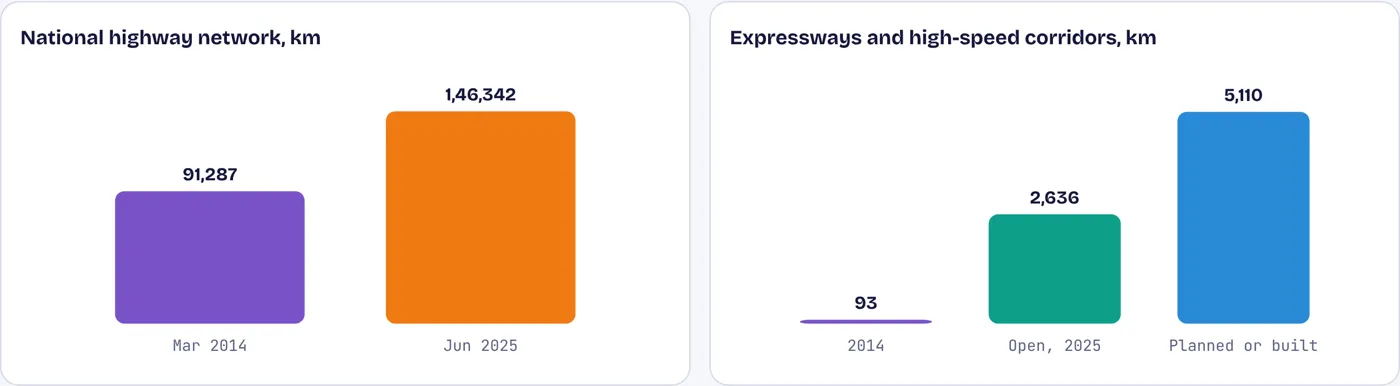
The national highway network grew by 60%, open expressways 28 times
National highways and high-speed corridors, km
Over 55,000 km were added to the national highway network in eleven years. Access-controlled expressways went from 93 km to more than 5,000 km planned or built, of which 2,636 km are open.
Source: Ministry of Road Transport and Highways via Business Today (July 2025).
Who paid
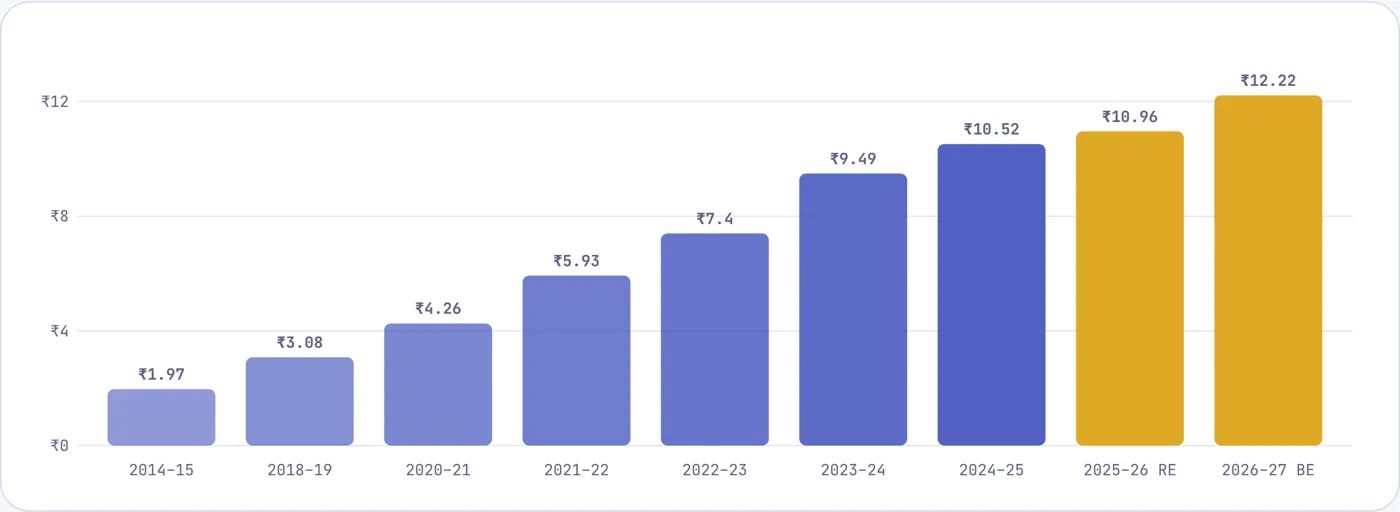
Central capital spending rose sixfold
Union government capital expenditure, ₹ lakh crore. Actuals except where marked.
The Union government chose to borrow for building rather than for consumption. Capital spending reached ₹12.2 lakh crore in the 2026–27 budget, about 3.1% of GDP, roughly double its share a decade earlier.
Source: Union Budget documents; SuperKalam (2018–19 actual, 2025–26 revised, 2026–27 budget).
Rails
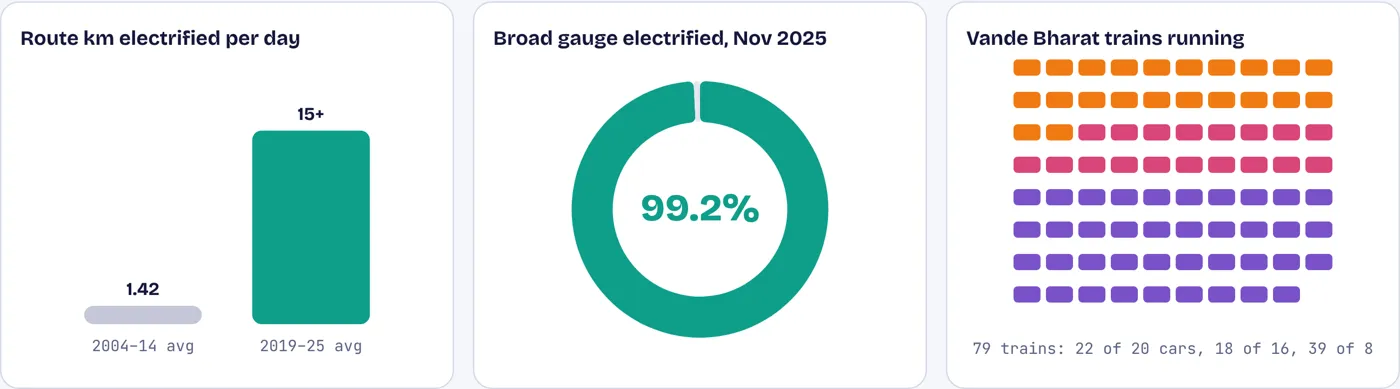
The railway network went almost entirely electric
Route km electrified per day, and the share of the broad-gauge network electrified, November 2025
From 2004 to 2014 Indian Railways electrified about 1.4 km of track a day. Since 2019 it has done more than 15 km a day. By November 2025, 69,427 of 70,001 route km of broad gauge were electric. Seventy-nine Vande Bharat trains now run, the first from 2019.
Source: Indian Railways via The Week (January 2026); Wikipedia, Vande Bharat Express (August 2026).
Cities
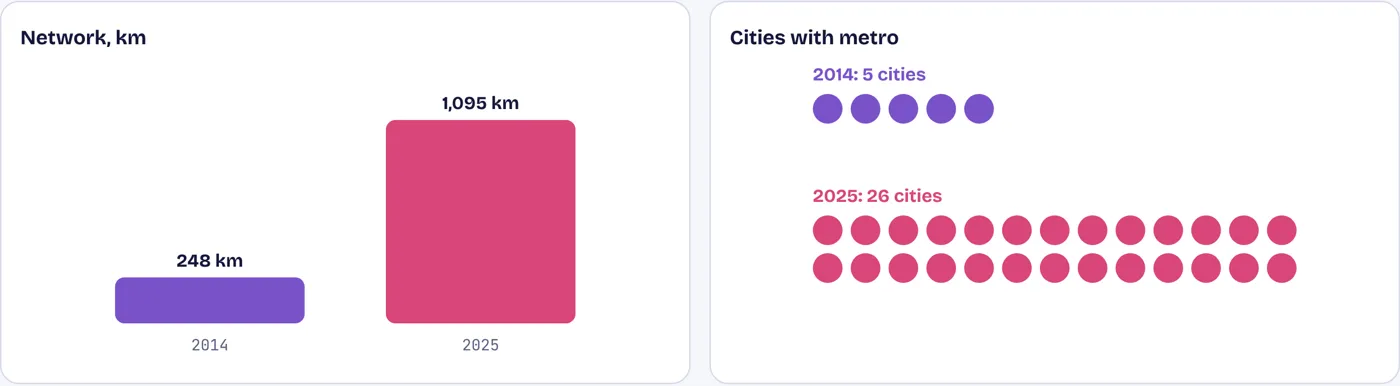
Metro rail in 26 cities instead of 5
Operational metro and regional rapid rail, km and cities
The metro network more than quadrupled to 1,095 km, including the first 55 km of the Delhi–Meerut rapid rail line. The annual central metro budget rose from ₹5,798 crore to ₹29,550 crore.
Source: Press Information Bureau (March 2026).
Runways
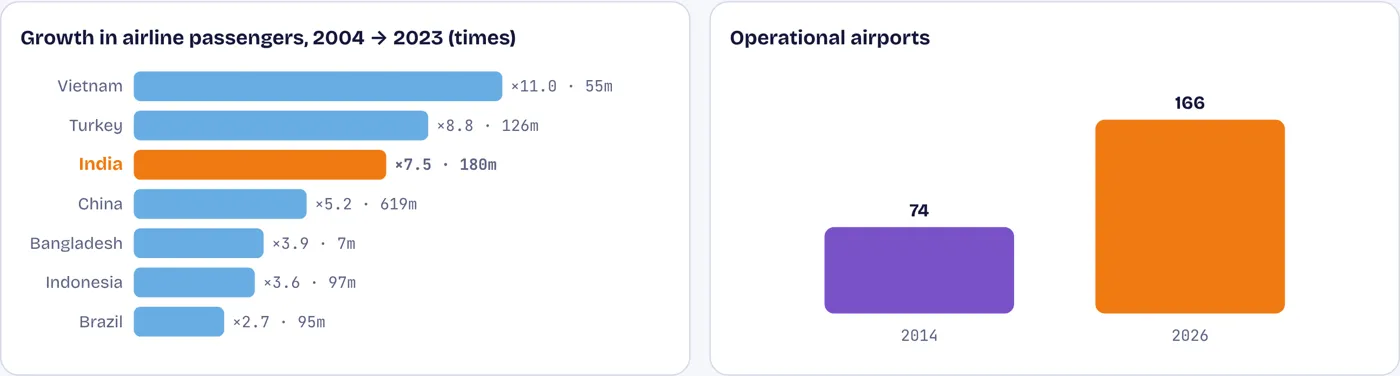
Airports more than doubled; air travel grew seven and a half times
Passengers carried by each country’s airlines, growth 2004 to 2023, and India’s airports
Indian airlines carried 180 million passengers in 2023, against 24 million in 2004. Among peers only Vietnam and Turkey grew faster. Operational airports rose from 74 in 2014 to 166 in 2026, many of them small regional strips under the UDAN scheme.
Source: World Bank WDI (ICAO), air passengers carried; Prime Minister’s statement via NewKerala (August 2026).
Ports
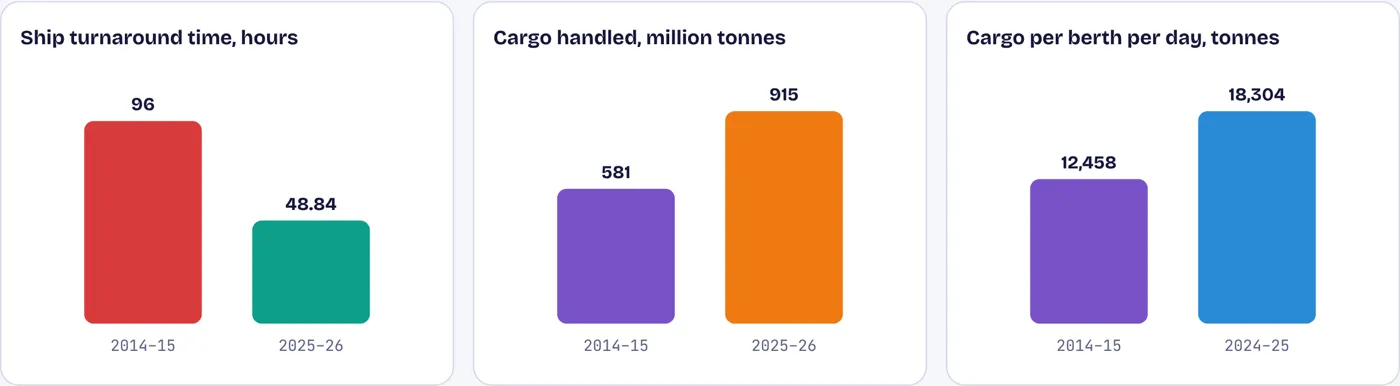
Ships now turn around in two days instead of four
India’s major ports, 2014–15 and the latest year
The average time a ship spends in a major port halved, from 96 hours to under 49. Cargo handled rose by more than half, and each berth now handles about 47% more cargo a day.
Source: Ministry of Ports via India Sea Trade News (2024–25) and Logistics Insider (2025–26, August 2026).
Against the peer panel
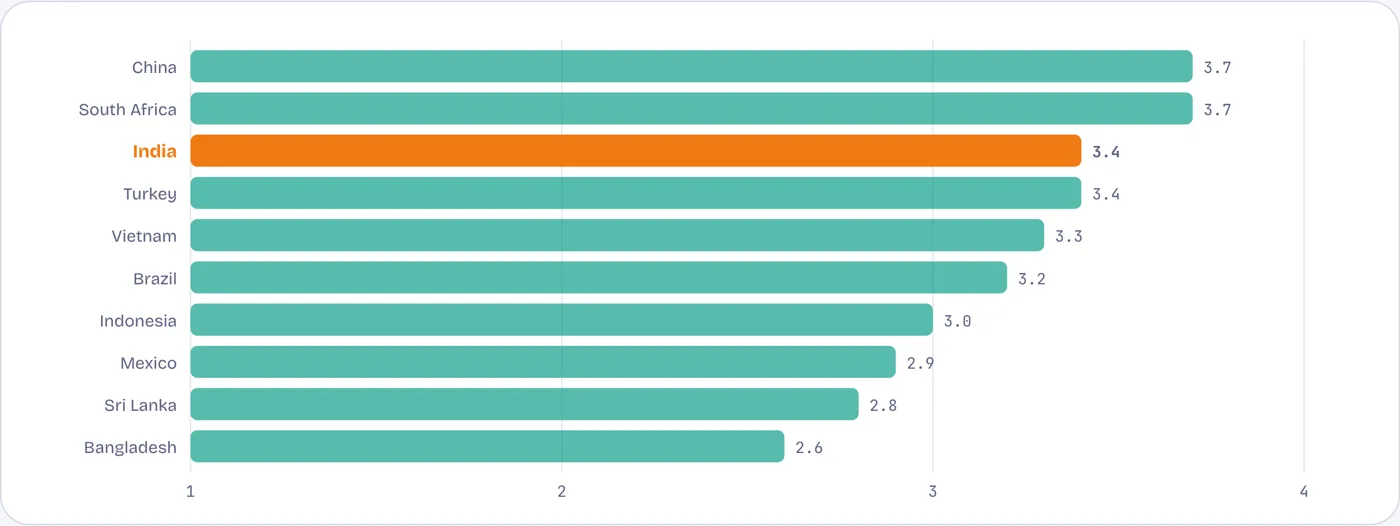
Logistics now rated above Vietnam and Indonesia, behind China
World Bank Logistics Performance Index, overall score, 1 (worst) to 5 (best), 2023 edition
India’s score rose from 3.07 in 2007 to 3.4 in 2023, ranking 38th of 139 countries. It is level with Turkey, ahead of every South Asian neighbour, and behind China and South Africa.
Source: World Bank, Logistics Performance Index, via WDI. Pakistan, Kenya and Morocco not scored in 2023.
Contested numbers
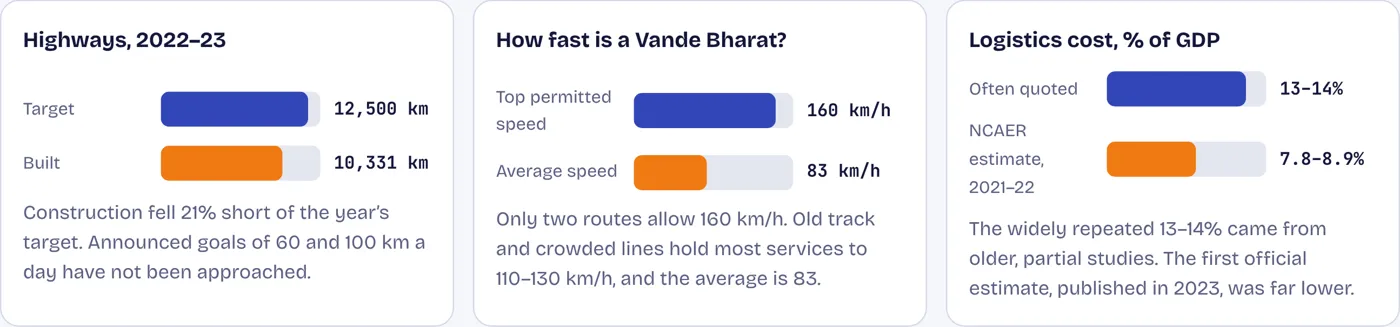
Three numbers that need a second look
Source: Deccan Herald (2023); Wikipedia, Vande Bharat Express; NCAER for DPIIT, Logistics Cost in India (2023).