In March 2014 India had under 3 gigawatts of solar power, about the size of two large coal plants. By June 2026 it had 162 gigawatts and the third-largest renewable fleet on earth.
The build-out
Solar went from almost nothing to the largest source of new power
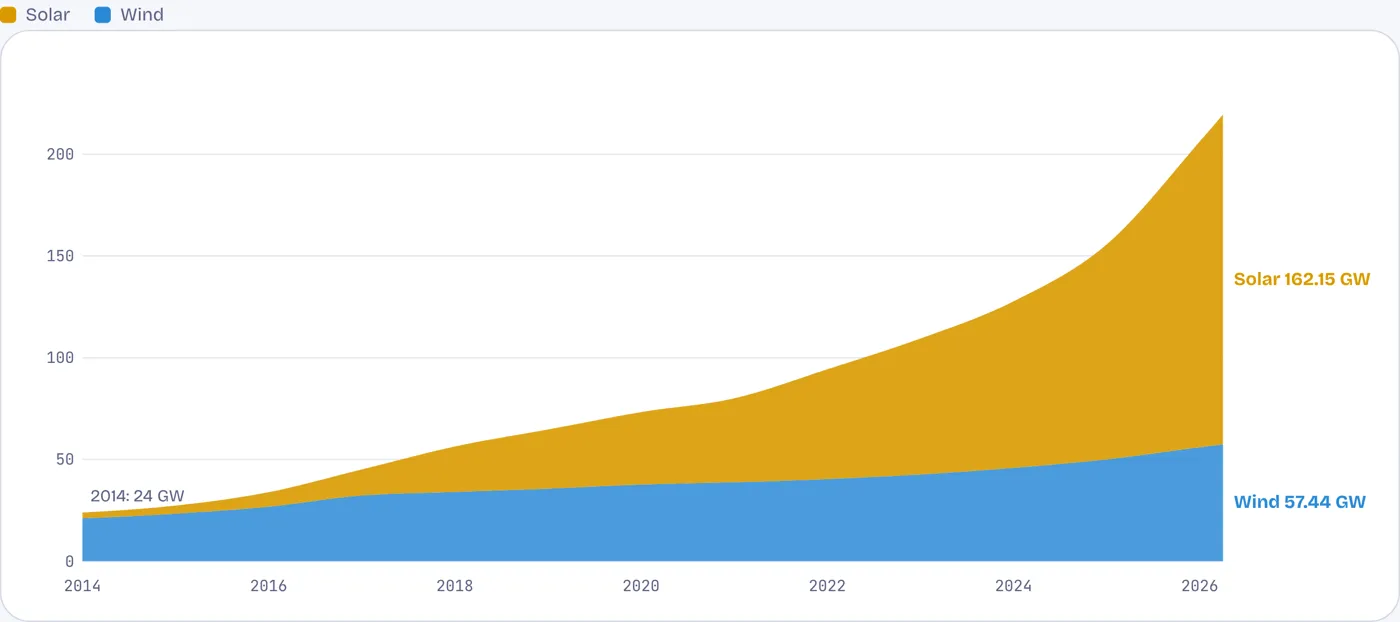
Installed solar and wind capacity, gigawatts, end of each financial year (March) and June 2026. Tap or tap or hover for values.
Wind led until 2020. Solar then overtook it and has since added six times as much capacity. Together they reached 220 GW in June 2026, about nine times the 2014 level.
Source: Ministry of New and Renewable Energy via Lok Sabha answer (solar, 2014–2023); Mercom (March 2026); Energetica India (June 2026); Wikipedia, Wind power in India (wind, 2015–2024).
The pace
A record 45 GW of solar in a single year
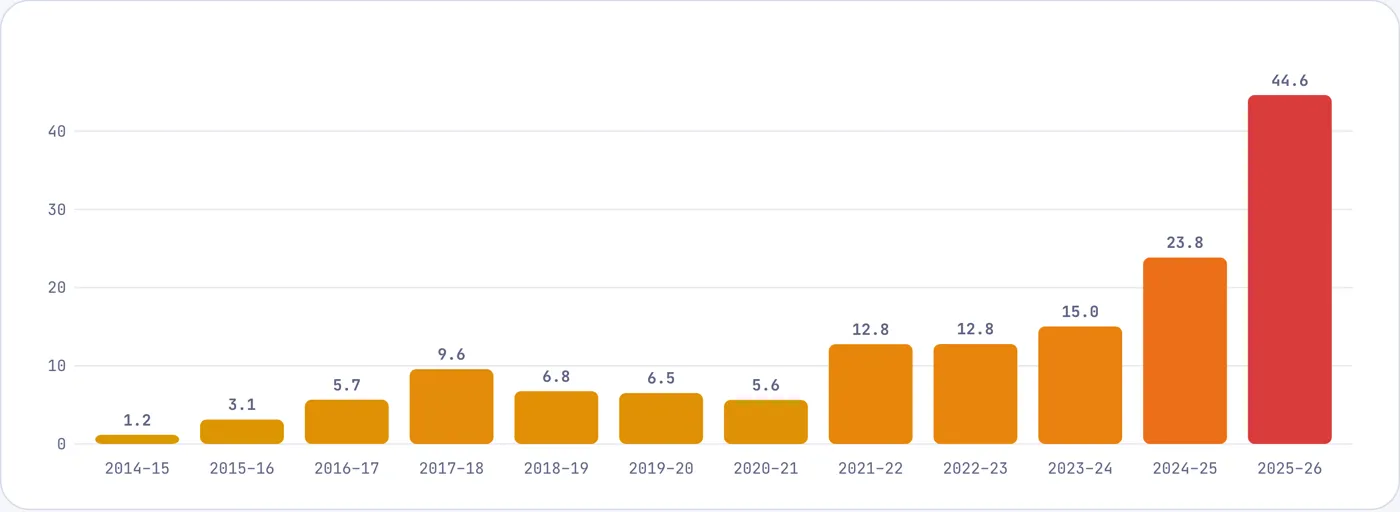
Solar capacity added each financial year, gigawatts
Annual additions stalled around 6 GW a year from 2018 to 2021, then doubled, and in 2025–26 nearly doubled again to 44.6 GW. India added more solar in that one year than its entire solar fleet in March 2020.
Source: MNRE via Lok Sabha; JMK Research (2025–26).
The price
Solar power became the cheapest new electricity in India
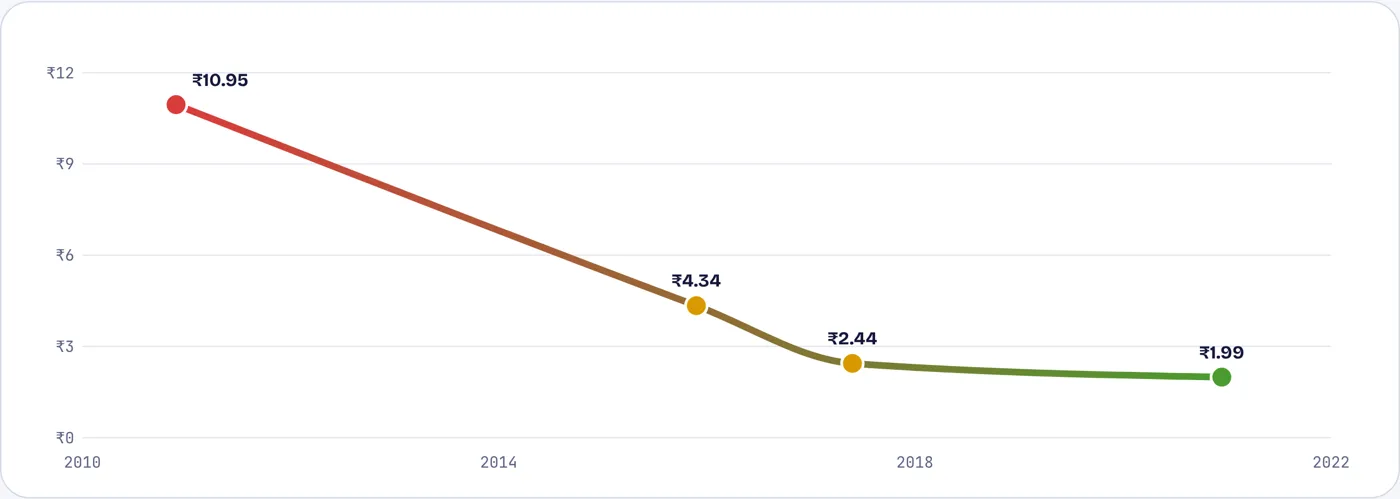
Record-low winning bids for utility-scale solar, ₹ per unit (kWh)
The winning price in national auctions fell more than 80% in a decade, to below ₹2 a unit in 2020, cheaper than power from most new coal plants. Competitive auctions, falling global panel prices and solar parks with land and grid connections ready did it.
Source: Powerline and Indian Infrastructure (December 2020); National Solar Mission and SECI auction results for earlier records.
World standing
Third in renewables, ahead of time on its climate pledge
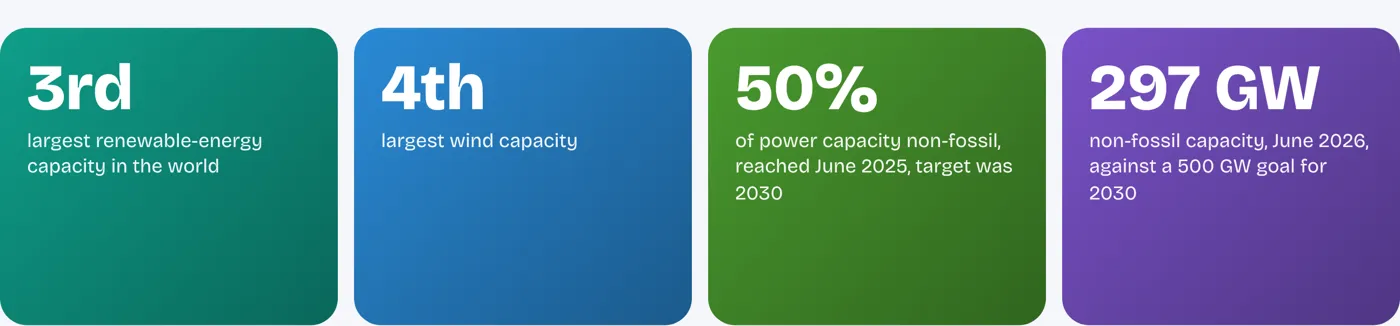
India promised at Paris that half its power capacity would be non-fossil by 2030. It got there in June 2025.
Source: IANS and Mercom (April 2026); Wikipedia, Wind power in India; Drishti IAS (July 2025).
What the grid actually burns
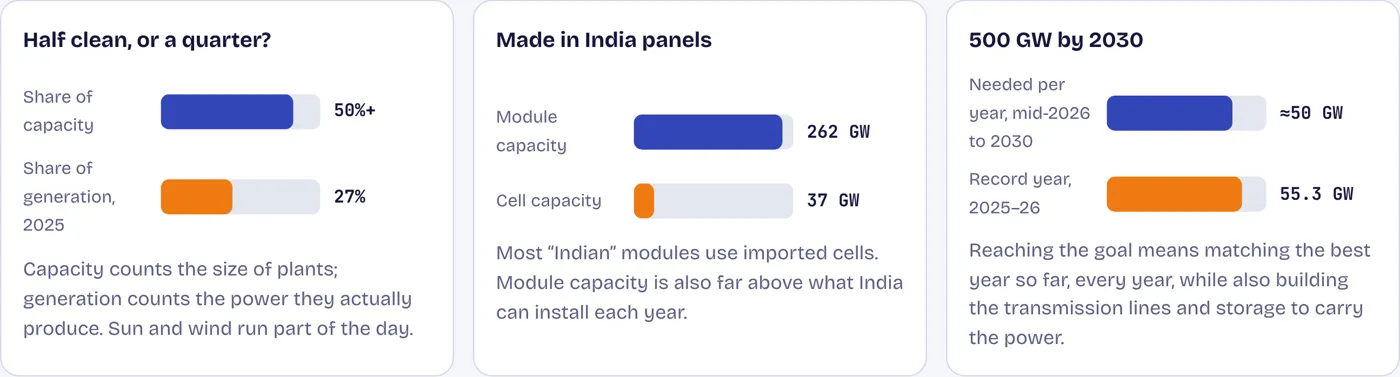
Half the capacity, but just over a quarter of the power
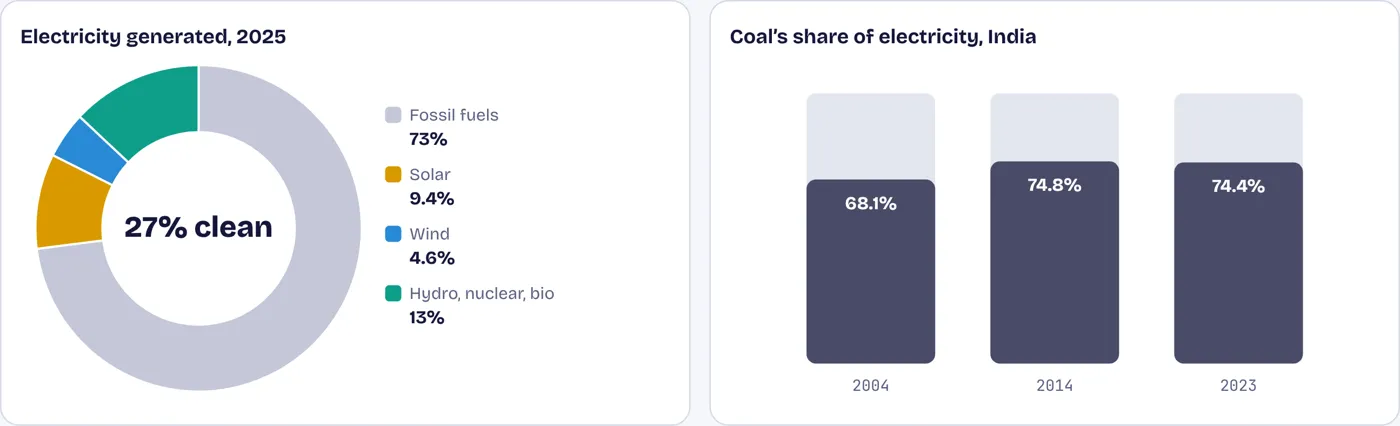
India’s electricity generation by source, 2025
Solar panels and wind turbines produce power only part of the day, so a gigawatt of them yields far less electricity than a gigawatt of coal. Solar supplied 9.4% of India’s electricity in 2025 and wind about 4.6%. Coal still supplied about three-quarters as recently as 2023, a larger share than in 2004, because demand grew faster than clean supply.
Source: Ember Global Electricity Review 2026 via pv magazine India; World Bank WDI (IEA), electricity from coal.
Against the peer panel
India still leans on coal more than most peers
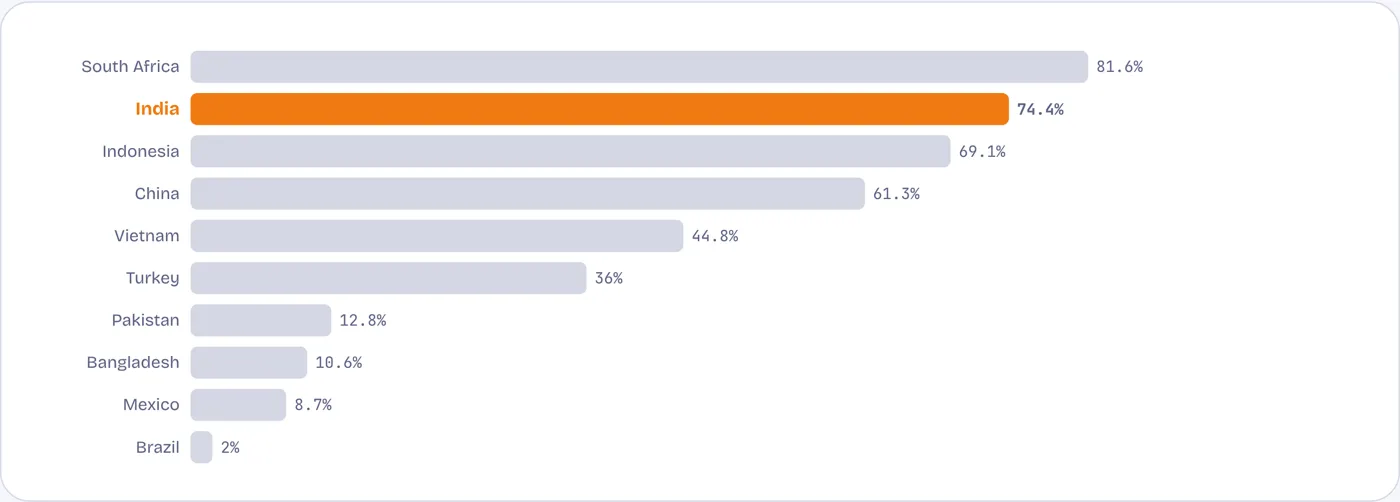
Share of electricity from coal, 2023
Only South Africa among the panel relies more heavily on coal. China, which built far more solar and wind, has brought coal down from 78% of its electricity in 2004 to 61%; India’s share went the other way.
Source: World Bank WDI (IEA).
Use and emissions
Low use, low emissions per person
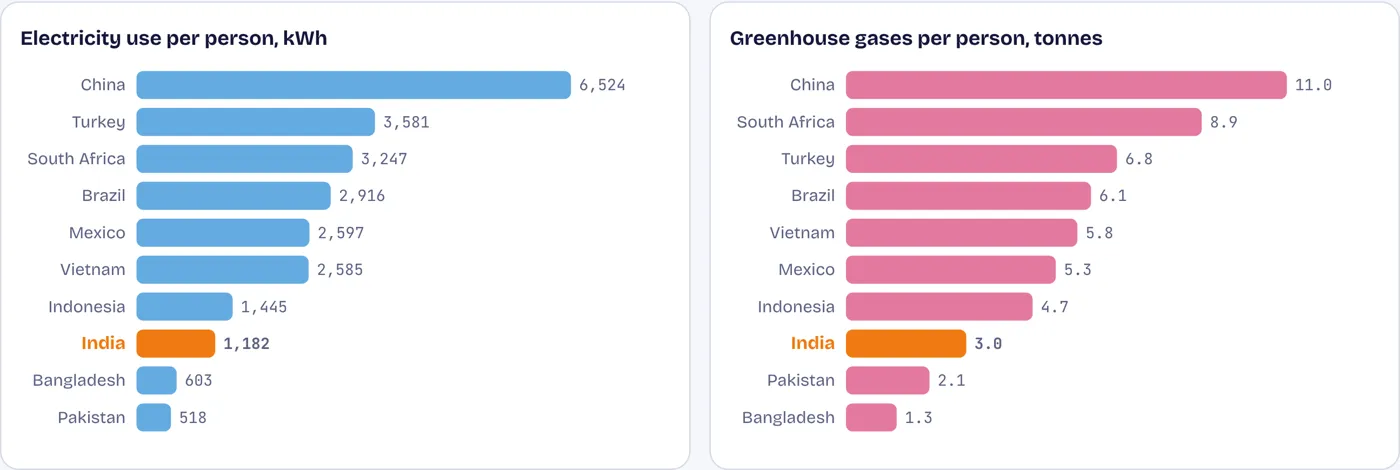
Electricity use per person (kWh, 2023) and greenhouse gas emissions per person (tonnes CO₂e, 2024)
Electricity use per Indian nearly tripled from 442 kWh in 2004 to 1,182 kWh, still less than half of Vietnam’s and a fifth of China’s. Emissions per person rose from 1.8 to 3.0 tonnes, about a quarter of China’s level.
Source: World Bank WDI (IEA; EDGAR greenhouse gas emissions).
Made in India?
Factories for panels boomed; for cells, much less
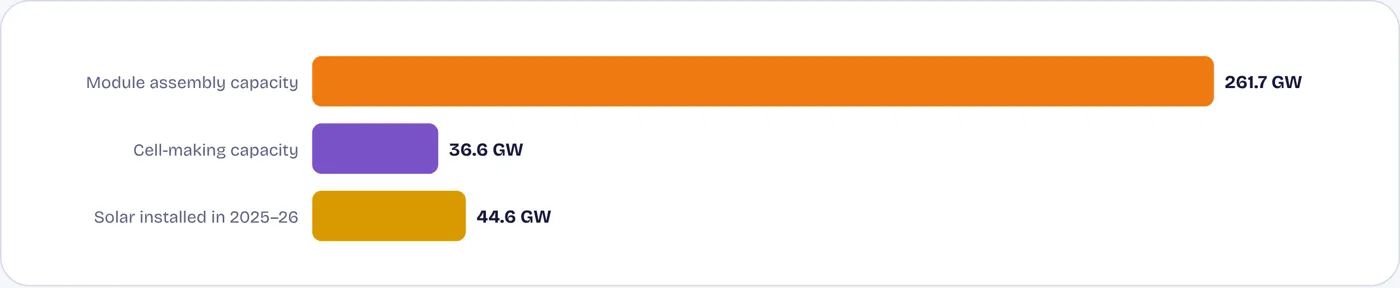
Annual solar manufacturing capacity, June 2026, gigawatts
India can now assemble more solar modules a year than it installs. But modules are mostly assembled from imported cells: cell-making capacity is one-seventh of module capacity, and cells made up 81% of solar imports in the first half of 2026.
Source: Mercom via PV Tech (September 2026).
Contested numbers
Three numbers that need a second look
Source: MNRE; Ember; Mercom via PV Tech.