Most economies that grew rich moved millions of people from farms into factories. India grew without doing so: manufacturing is a smaller share of its economy than when the boom began.
The take-off that didn’t happen
At India’s income, most countries had more factories and more women at work
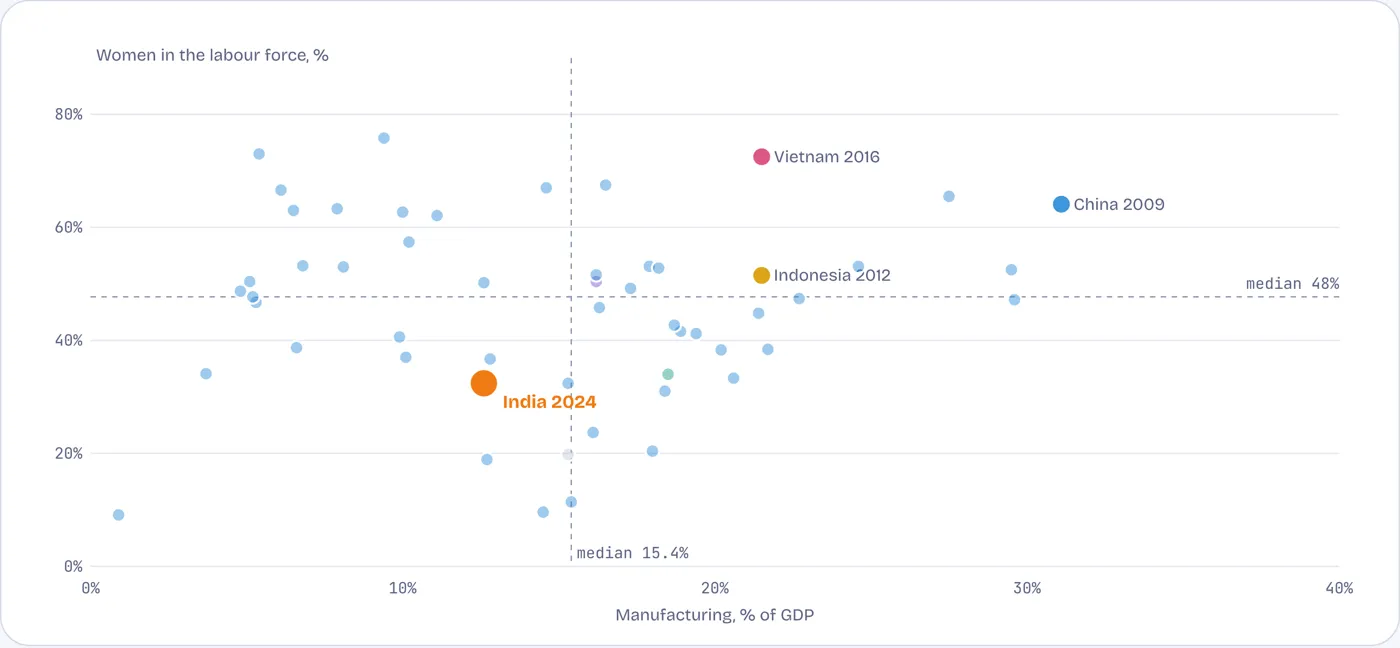
53 countries at the moment their income per person matched India’s 2024 level: manufacturing share of GDP against women’s labour-force participation. Tap or hover a dot.
At India’s level of income, the typical country had 15% of its economy in manufacturing and 48% of women in the labour force. India has 12.6% and 32%. China, when it was as rich as India is now, had 31% in manufacturing and 64% of women working. Factories are the usual route by which women and farm workers enter paid work.
Source: World Bank WDI; income per person at PPP (constant 2021 international $). For each country, the year between 1990 and 2024 when its income was closest to India’s 2024 level, within 12%.
The shrinking share
Bangladesh and Vietnam built factories; India’s share fell
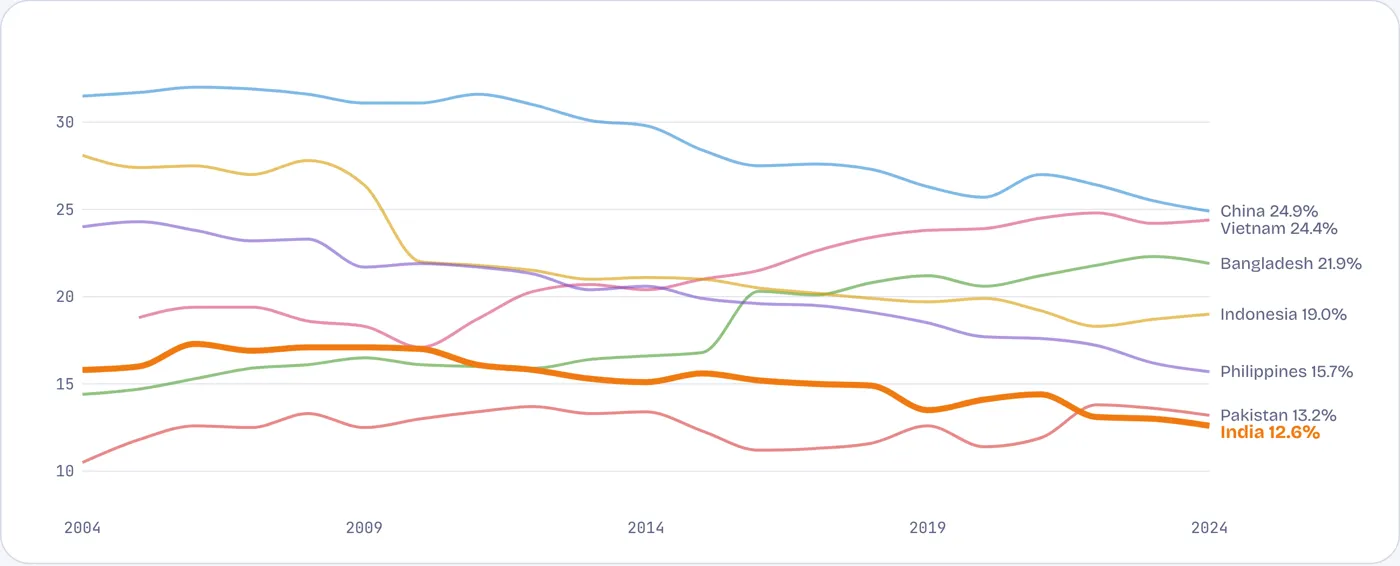
Manufacturing value added, % of GDP, 2004–2024. Tap or hover a line.
India’s share peaked at 17% in 2010 and has fallen since. Bangladesh rose from 14% to 22% on garments, Vietnam from 17% to 24% on electronics. China and Indonesia fell too, but from far higher levels.
Source: World Bank WDI (national accounts). Vietnam and China series start later or are rebased.
Overtaken
Nineteen countries moved past India
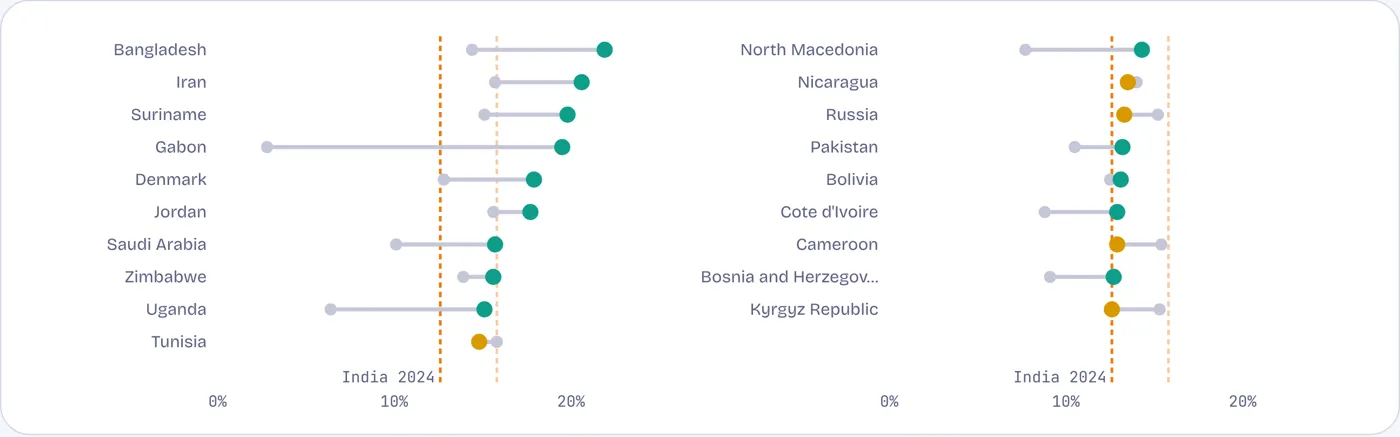
Countries with a smaller manufacturing share than India in 2004 but a larger one in 2024: share in 2004 → 2024
Some passed India by building industry, like Bangladesh, Uganda and Pakistan; others because India’s own share fell, like Russia and Tunisia, whose shares also declined.
Source: World Bank WDI.
The world’s workshop
India makes under 4% of the world’s manufactured goods
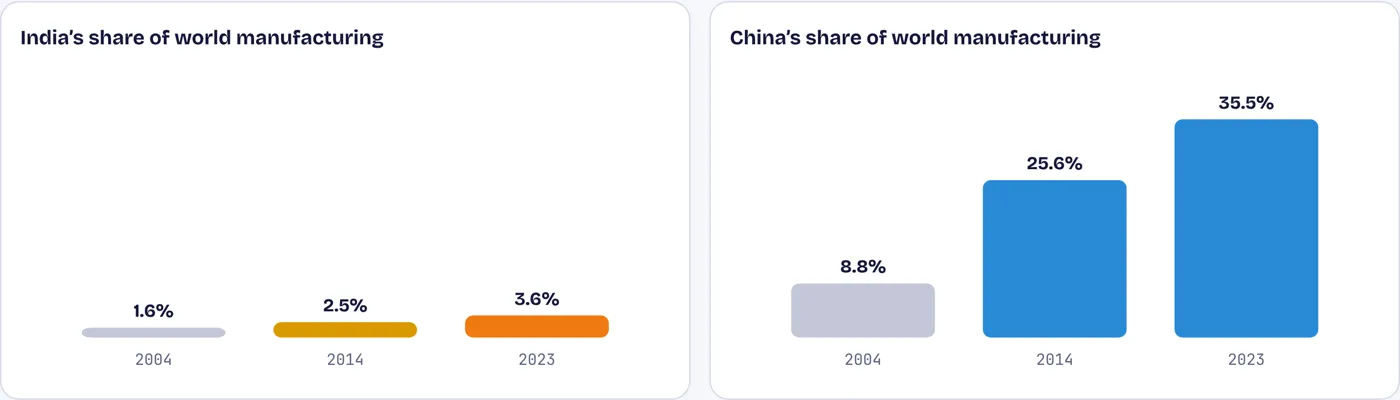
Share of world manufacturing value added, current US$
India’s share of world manufacturing more than doubled, from 1.6% to 3.6%, because its economy grew. China’s went from 9% to 36% over the same years.
Source: calculated from World Bank WDI, manufacturing value added (current US$), countries with data.
Selling goods
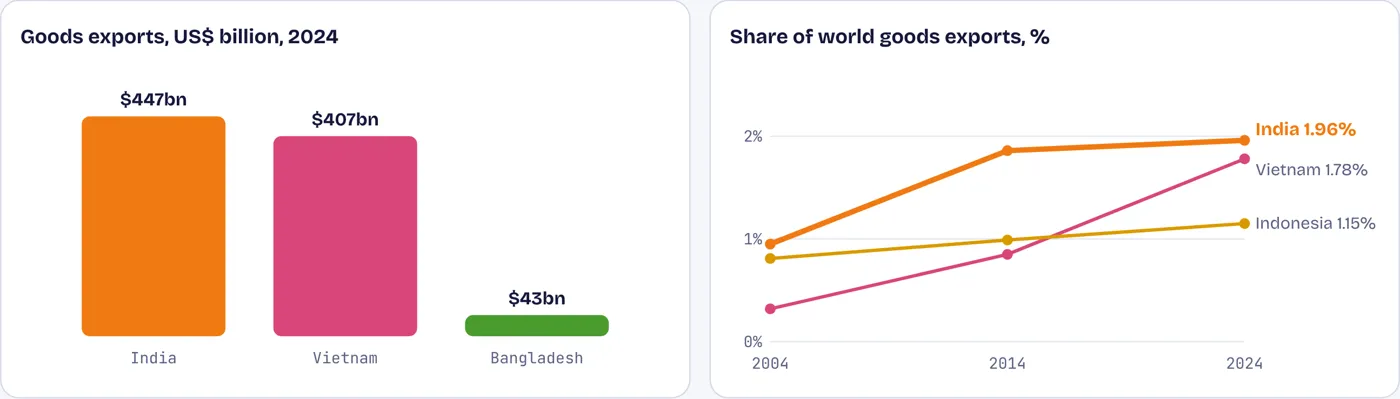
Vietnam, with a fourteenth of India’s people, exports almost as many goods
Goods exports, US$ billion, and share of world goods exports
India’s goods exports grew from $78 billion in 2004 to $447 billion in 2024, but its share of world trade has been stuck below 2% for a decade. Vietnam’s grew from $26 billion to $407 billion.
Source: World Bank WDI (balance of payments, goods exports, current US$).
Where people work
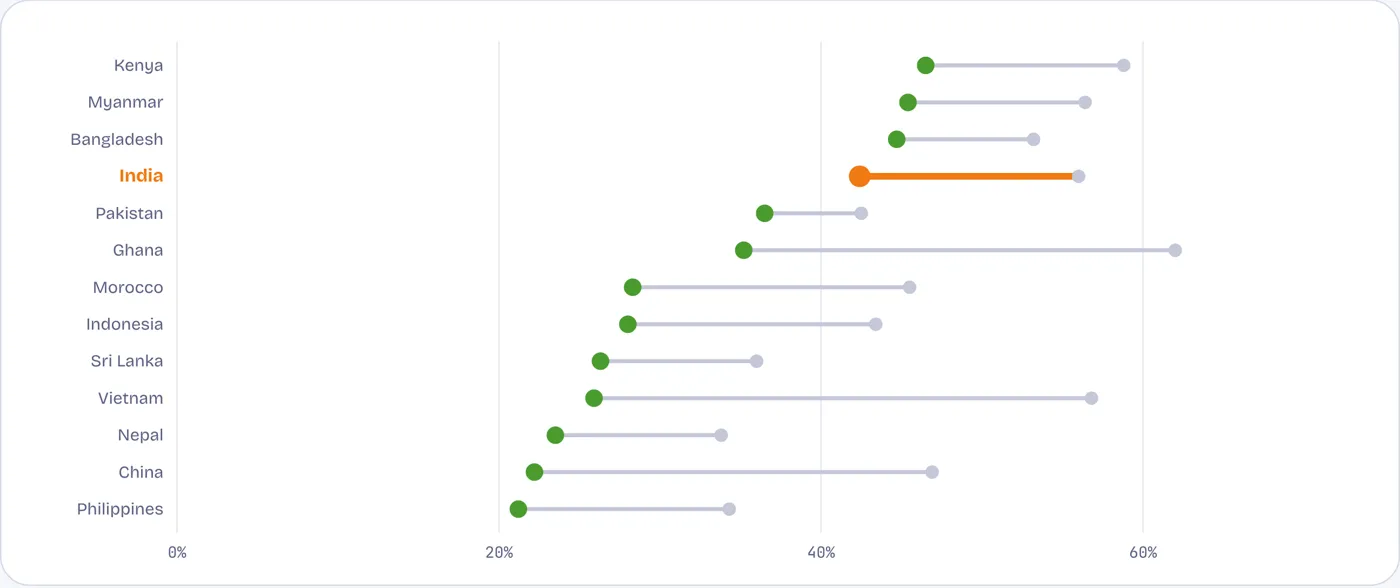
Four in ten Indians still work on farms
Share of workers in agriculture, 2004 → 2024 (ILO modelled estimates)
The farm share of work fell from 56% to 42%, but it rose again after 2019 as workers returned to villages. Industry’s share rose from 18% to 25%, much of it in construction rather than factories. In Vietnam, China and Indonesia fewer than three in ten now work on farms.
Source: International Labour Organization modelled estimates, via WDI.
One bright spot
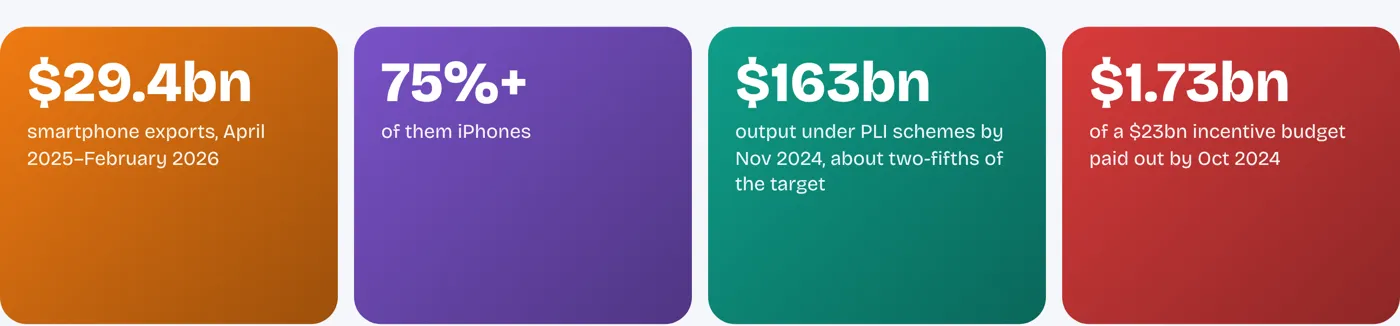
Smartphones became one of India’s largest exports
Production-linked incentives drew Apple’s suppliers to India. iPhones are now India’s largest branded export. Much of the value of each phone is still in imported components; assembly creates jobs but less domestic value than the headline numbers suggest.
Source: Business Today (April 2026); Reuters via Malay Mail (March 2025).
Contested numbers
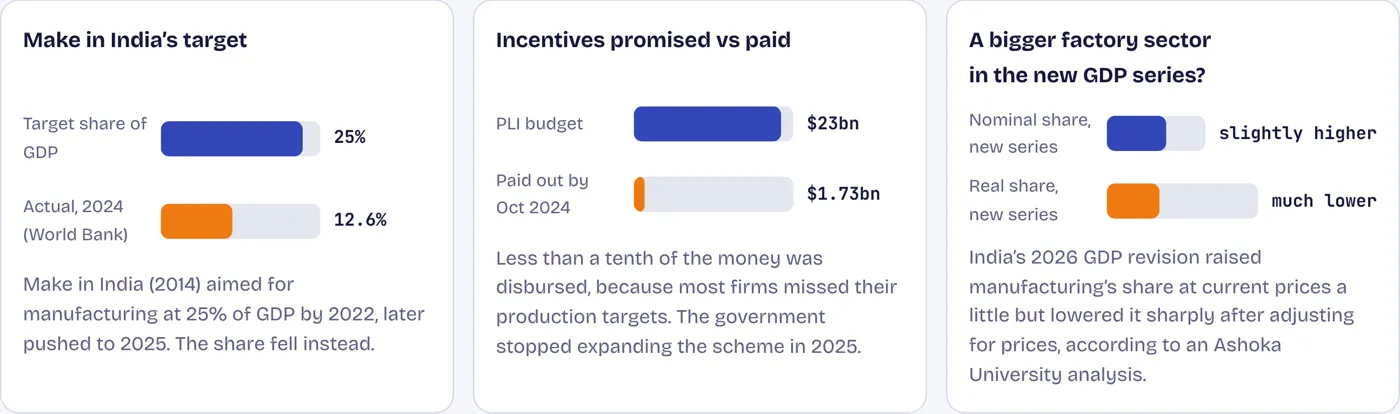
Three numbers that need a second look
Source: Make in India (2014); Reuters via Malay Mail (March 2025); World Bank WDI; Ashoka University ICPP (2026).