India built highways faster than almost any country, and road deaths rose with them. Around the world deaths fell after 2010; in India they reached a record in 2024, about 485 a day.
The count
Road deaths almost doubled in twenty years
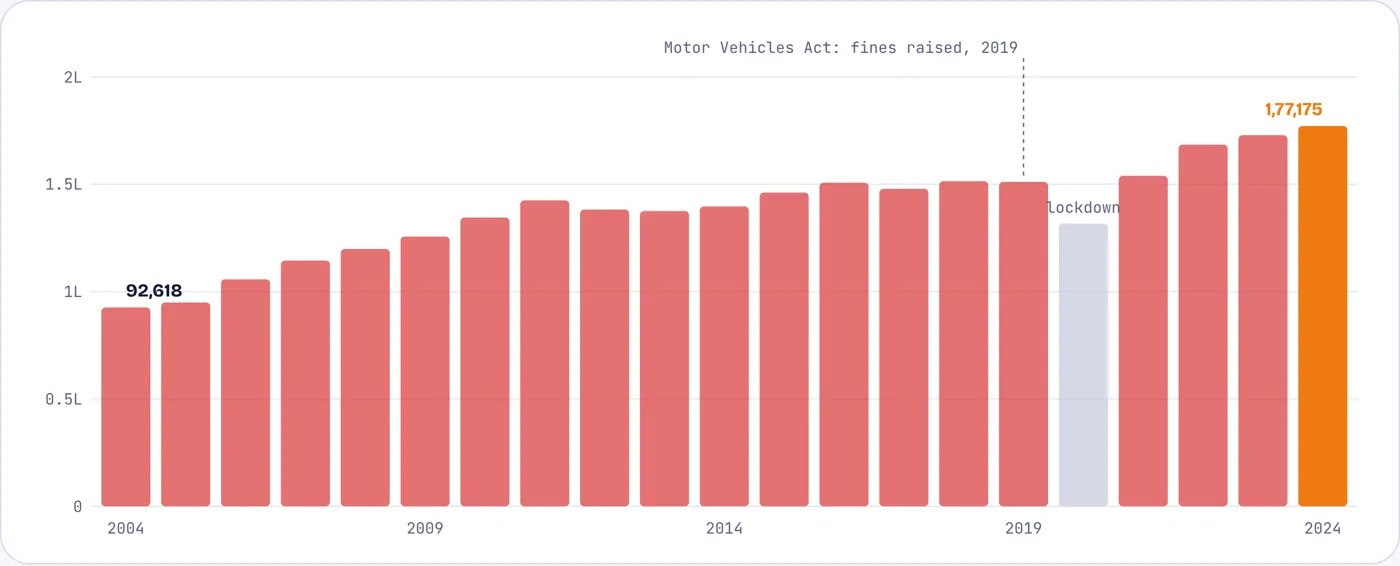
People killed in road crashes in India, as reported by police, 2004–2024. Tap or hover a bar.
Deaths rose every year until 2011, held near 1.4–1.5 lakh for most of the 2010s, dipped during the 2020 lockdown, and have set a new record each year since. The 2019 law that raised traffic fines up to tenfold did not reverse the trend.
Source: Ministry of Road Transport and Highways (MoRTH), Road Accidents in India, annual reports; 2024 from MoRTH via ETV Bharat.
Against the world
The world began cutting road deaths; India did not
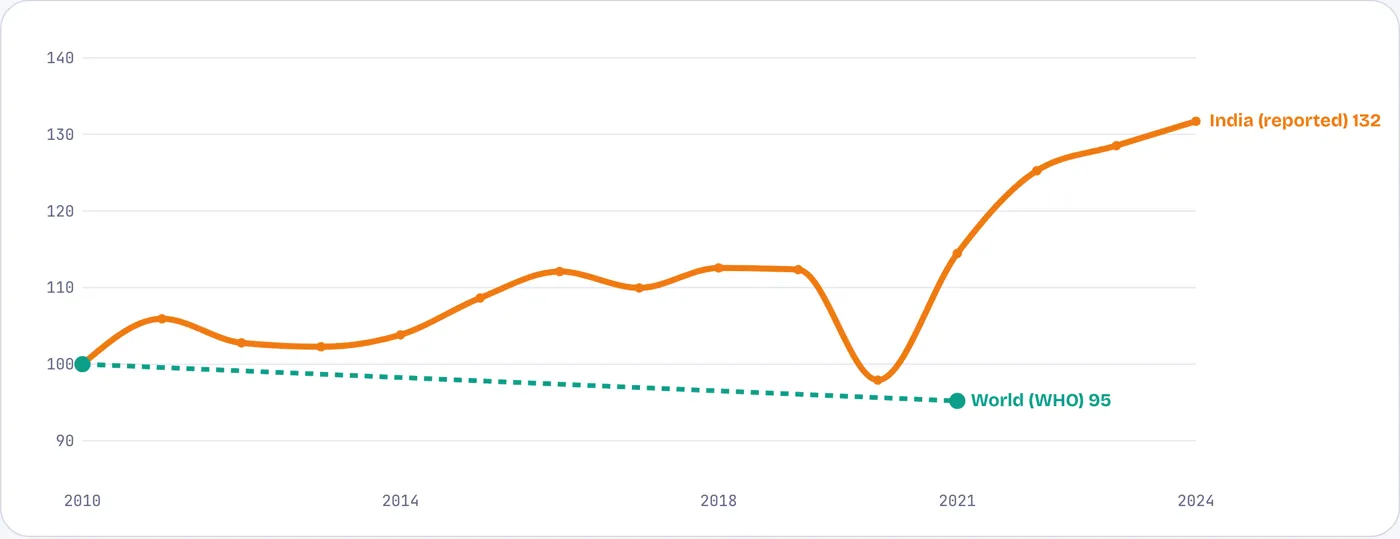
Road deaths indexed to 2010 = 100. India: reported deaths, every year. World: WHO estimates for 2010 and 2021.
Between 2010 and 2021 road deaths worldwide fell 5%, to 1.19 million a year, even as the number of vehicles grew. Ten countries, including Japan, Norway and the UAE, more than halved theirs. India’s reported deaths rose 14% over the same years, and kept rising to 2024.
Source: WHO, Global Status Report on Road Safety 2023, via Deccan Herald; MoRTH.
Per person
India’s death rate is middling, but it has not fallen
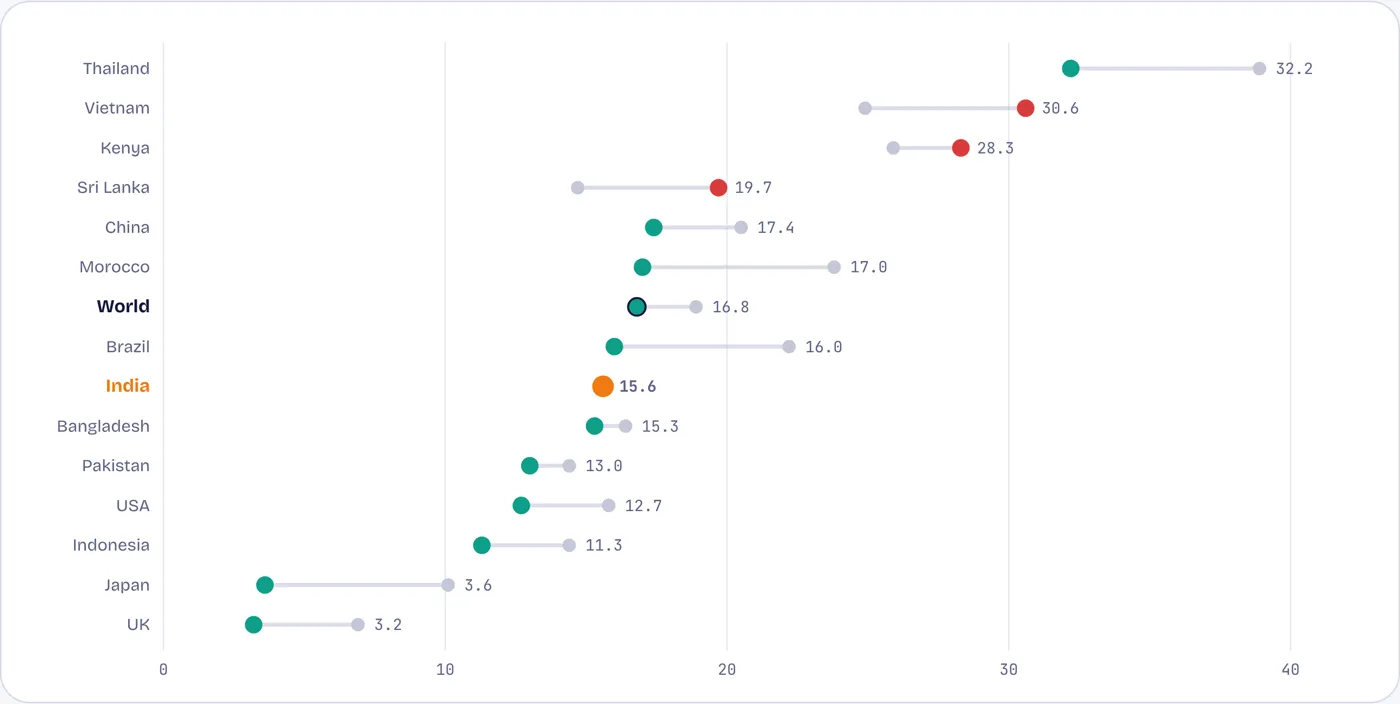
WHO-modelled road deaths per 100,000 people, 2004 → 2019. Tap or hover a row.
Measured per person, India is not an outlier: by WHO’s model its rate of 15.6 is below the world’s and below the typical country at its income. What stands out is that it did not move in fifteen years. China, Brazil, Morocco and Thailand cut their rates by between a sixth and nearly a third; Japan and Britain by more than half.
Source: WHO Global Health Estimates, via World Bank WDI. WHO’s modelled estimates are higher than India’s police-reported count.
Standing still
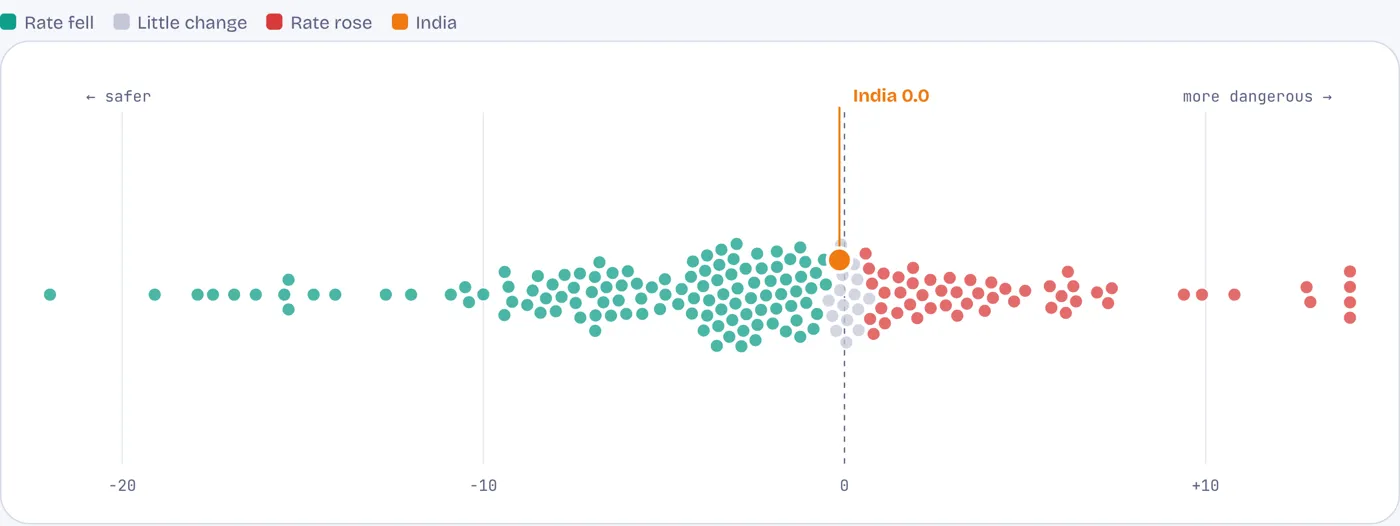
115 of 183 countries made their roads safer; India stayed where it was
Change in road deaths per 100,000 people, 2004 to 2019. Each dot is a country. Tap or hover a dot.
Most countries, rich and poor, lowered their road death rate as they grew. India’s change was zero to one decimal place. Its large and growing population means that a flat rate still produces more deaths each year.
Source: WHO Global Health Estimates, via World Bank WDI. “Little change” is within 0.5 deaths per 100,000.
Who dies
Two in three of the dead were on two wheels or on foot
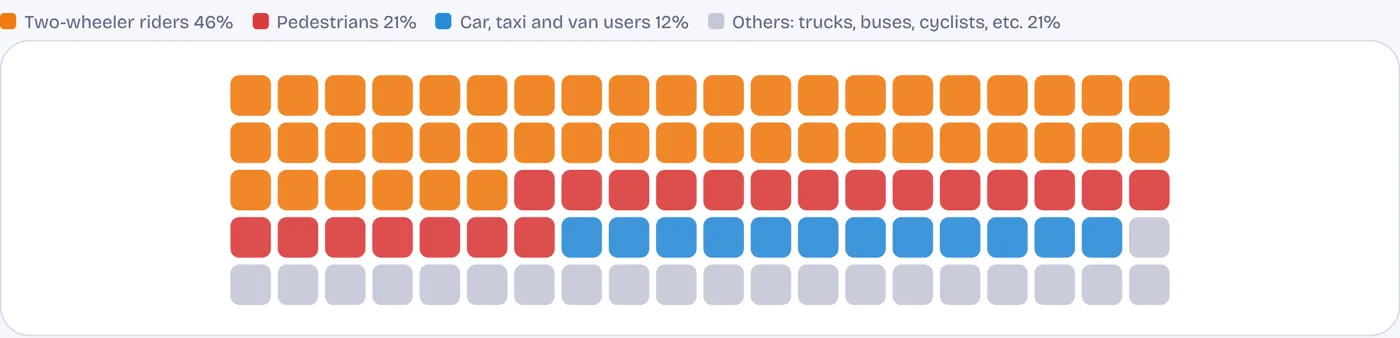
Road deaths in 2024 by road user: 100 squares, one for each 1%
Indian roads are built for cars and trucks but used mostly by people on scooters, motorcycles and foot. Two-wheeler riders were 46% of the dead and pedestrians 21%. Two-thirds of those killed in 2023 were aged 18 to 45, in their working years.
Source: MoRTH, Road Accidents in India 2024, via ETV Bharat; age share from the 2023 report, via NEXT IAS.
Why they die
Speed, and no helmet
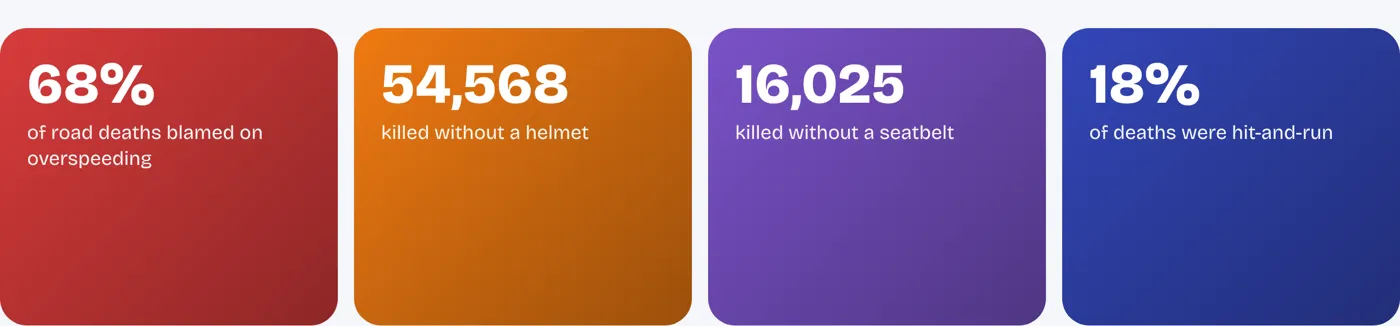
Causes recorded in police reports, 2023
Police attribute two-thirds of deaths to overspeeding. More than 54,000 people died without a helmet and 16,000 without a seatbelt, though both are compulsory. Nearly one death in five was a hit-and-run. These are failures of enforcement, not of law.
Source: MoRTH, Road Accidents in India 2023, via The Week / PTI.
The new highways
National highways are 2% of roads and carry over a third of the deaths
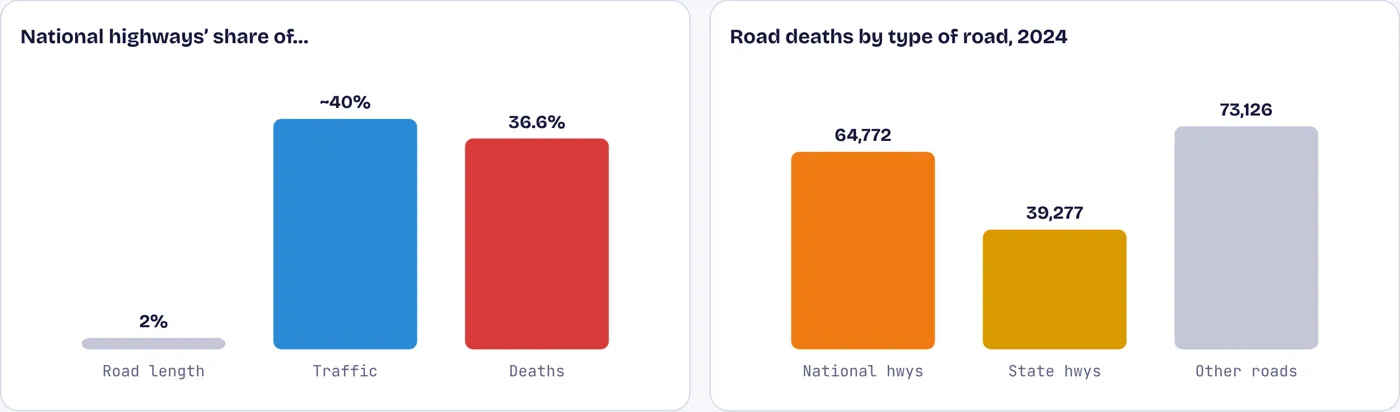
National highways’ share of road length, traffic and deaths; and road deaths by type of road, 2024
National highways carry about 40% of all road traffic, so their share of deaths roughly matches their share of traffic. The problem is how they are used: fast trucks and cars share lanes with two-wheelers, tractors and people on foot, often with no crossing for kilometres.
Source: MoRTH via ETV Bharat (deaths by road type); MoRTH via Anantam IAS (road length and traffic share).
Counting the dead
India’s official count may miss a third to a half of road deaths
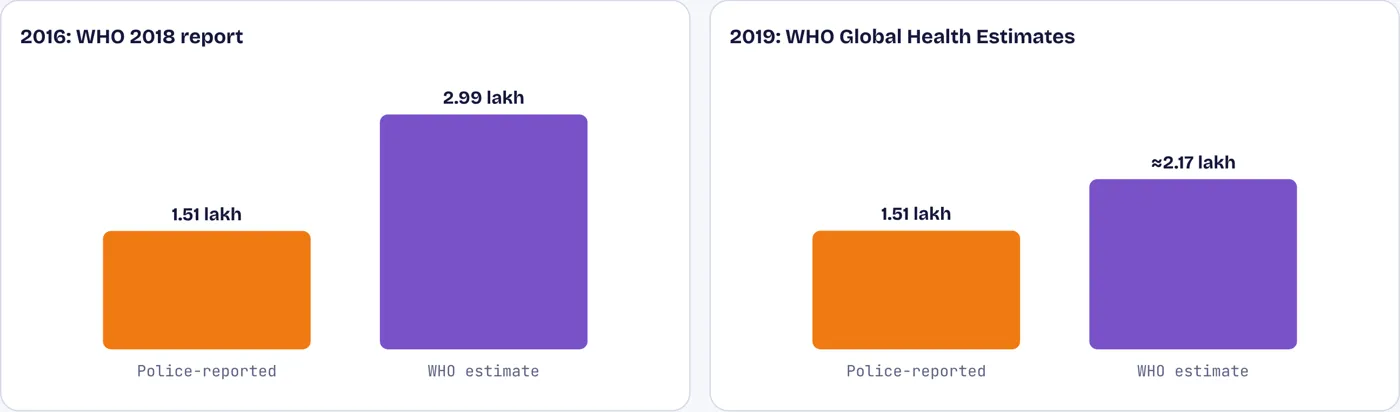
Police-reported deaths against WHO estimates for the same year
Police records miss deaths that occur later in hospital, or that are never reported. WHO’s 2018 report put India’s road deaths at about 3 lakh in 2016, twice the official count. WHO’s newer model is lower but still about 43% above the police figure for 2019. Whatever the true number, it is higher than the one that guides policy.
Source: WHO, Global Status Report on Road Safety 2018, India country profile; WHO Global Health Estimates via WDI, multiplied by population; MoRTH.
Contested numbers
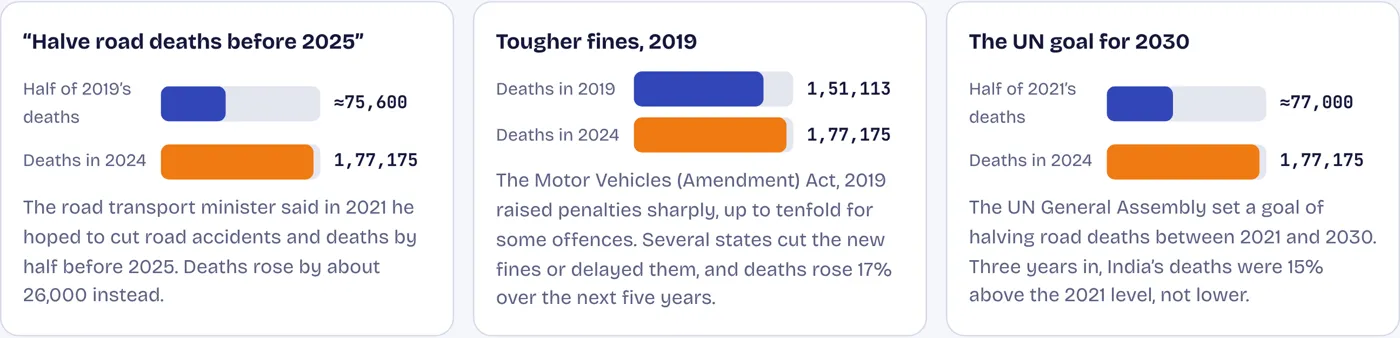
Three numbers that need a second look
Source: Business Today (February 2021); Motor Vehicles (Amendment) Act, 2019; UN General Assembly resolution 74/299 (2020); MoRTH.