India built solar power faster than almost any country, yet its air is among the dirtiest on earth. Only five countries recorded worse air in 2025, and most of the world’s most polluted cities are Indian.
The worst air
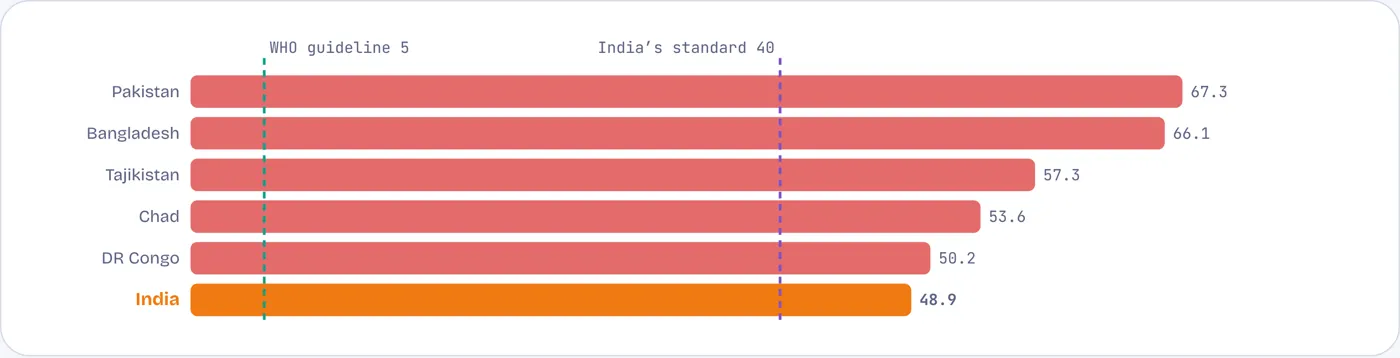
Only five countries recorded dirtier air than India in 2025
Annual average PM2.5, µg/m³, population-weighted, from ground monitors, 2025
India’s average fell 3% in 2025, to 48.9 µg/m³. That is still nearly ten times the WHO guideline and above India’s own, much looser, standard of 40. Its neighbours Pakistan and Bangladesh are worse: the air of the Indo-Gangetic plain does not stop at borders.
Source: IQAir, World Air Quality Report 2025, via IQAir and Vajiram & Ravi. WHO guideline: 5 µg/m³; India’s national standard: 40 µg/m³.
Against the world
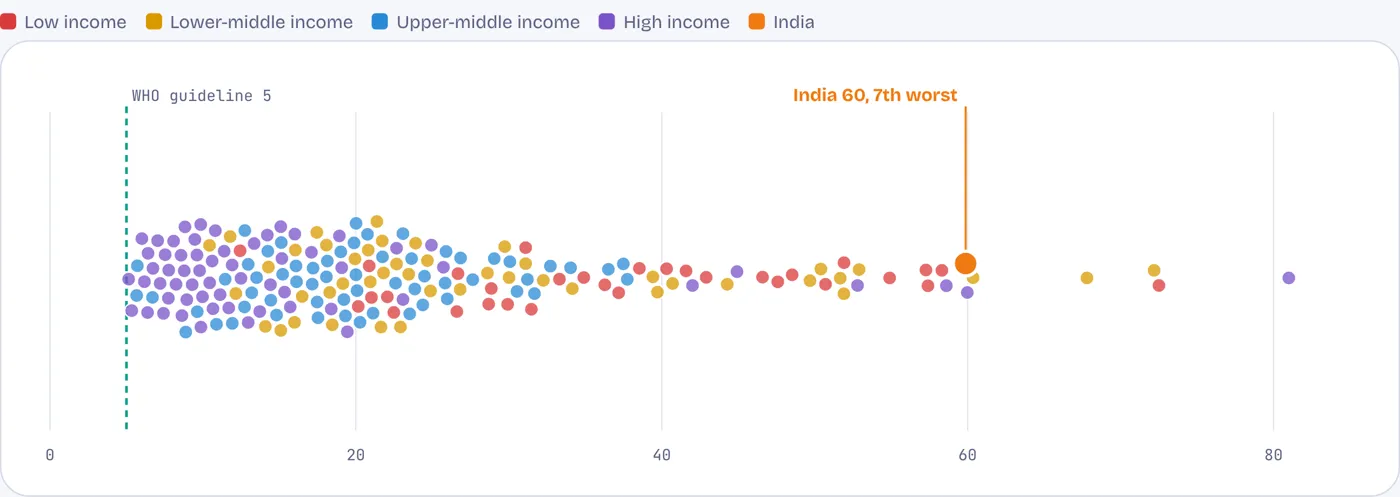
Almost every poor country breathes cleaner air than India
Annual exposure to PM2.5, 2019, WHO-modelled estimates for 198 countries. Each dot is a country; colour shows income group. Tap or hover a dot.
On WHO’s model, India had the seventh-dirtiest air of 198 countries in 2019. Most of those ahead of it are desert states whose air is thick with natural dust, such as Qatar, Niger and Mauritania. Thirty of 31 low-income countries had cleaner air than India; the typical one was at 36 µg/m³ against India’s 60.
Source: WHO/Global Burden of Disease estimates, via World Bank WDI. Satellite-based model; values differ from monitor averages.
Poorer, cleaner
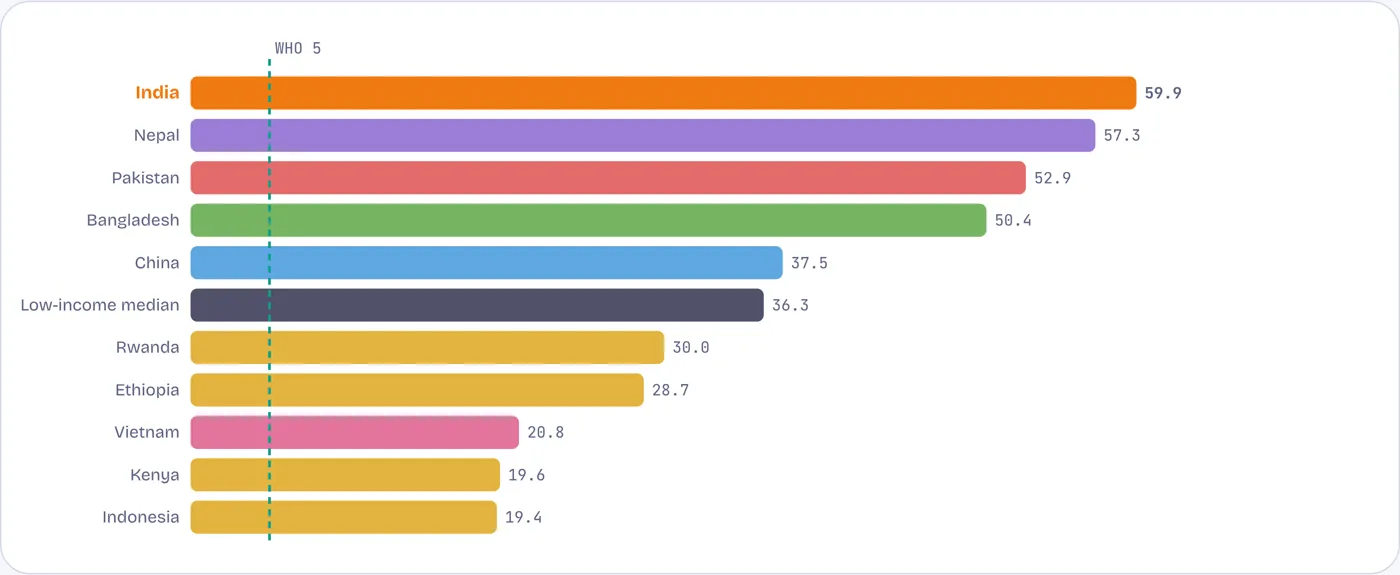
Kenya, Ethiopia and Rwanda breathe far cleaner air
Annual exposure to PM2.5, 2019, µg/m³ (WHO-modelled)
Countries far poorer than India, and still burning wood and charcoal, have cleaner outdoor air. India’s problem is the scale of what is burned on a crowded plain: coal in power plants and factories, diesel, crop stubble, household fuel and construction dust, trapped by winter weather in the north.
Source: WHO/Global Burden of Disease estimates, via World Bank WDI.
The cities
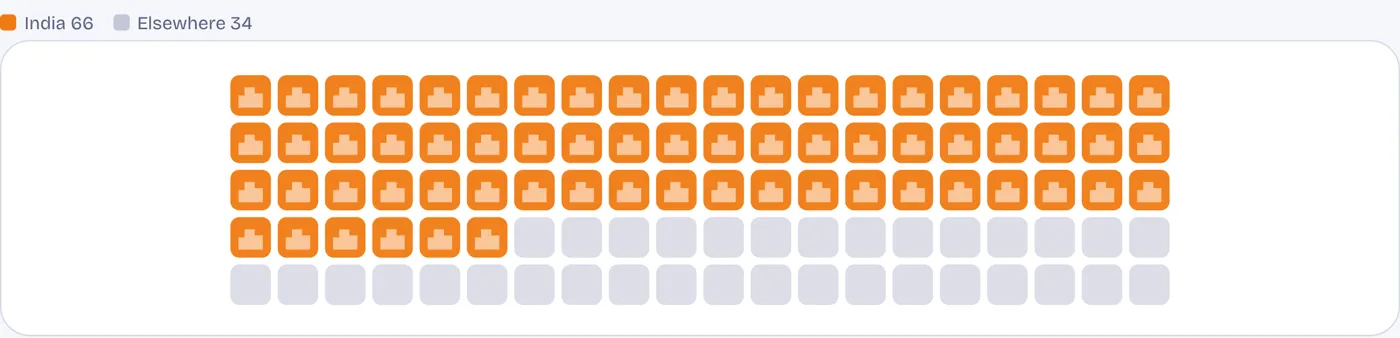
Two of every three of the world’s most polluted cities are Indian
The 100 most polluted cities in the world, 2025: one square per city
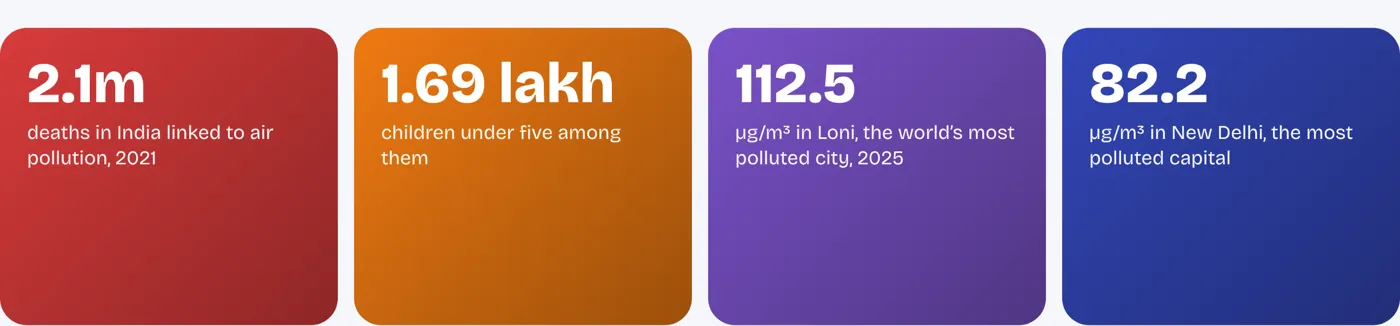
The most polluted city in the world in 2025 was Loni, on the edge of Delhi, at 112.5 µg/m³. Byrnihat in Meghalaya and New Delhi followed among Indian cities. Delhi, at 82.2, was at a three-year low and was still the most polluted capital in the world.
Source: IQAir, World Air Quality Report 2025.
The cost
Dirty air is the biggest single threat to life in South Asia
Air pollution was linked to about 2.1 million deaths in India in 2021, including some 1.7 lakh children under five. It is the leading risk factor for death in South Asia, ahead of high blood pressure, poor diet and tobacco.
Source: Health Effects Institute, State of Global Air 2024, via The South First.
Years of life
The average Indian loses three and a half years of life to dirty air; a Delhi resident eight
Life expectancy lost compared with air that meets the WHO guideline, years, 2023
The University of Chicago’s Air Quality Life Index estimates how much longer people would live if the air met WHO’s guideline. Indians would gain 3.5 years on average, almost double the global figure. In Delhi the gain would be 8.2 years; meeting just India’s own standard would add 4.7.
Source: Energy Policy Institute at the University of Chicago, Air Quality Life Index 2025.
What did work
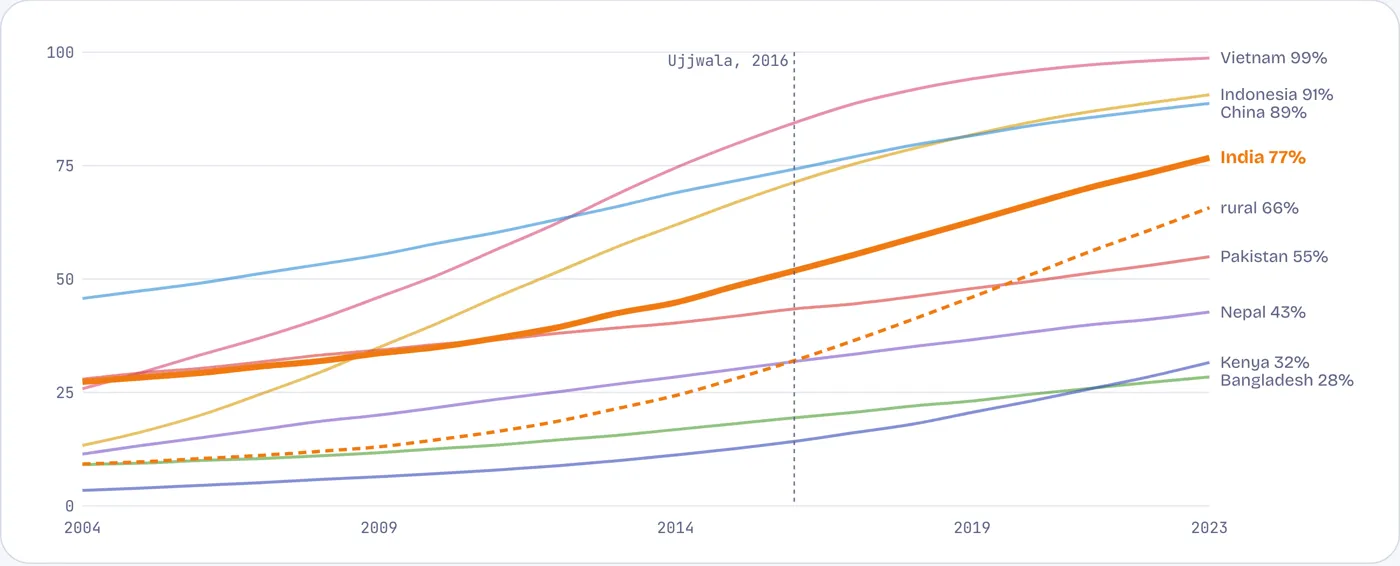
Clean cooking fuel reached most homes, and cut smoke indoors
Share of people mainly cooking with clean fuels such as LPG, gas or electricity, %, 2004–2023. Tap or hover a line.
Ujjwala connections, launched in 2016, took LPG to poor rural households. Three Indians in four now cook mainly with clean fuel, up from about one in four in 2004; in villages the share rose from 9% to 66%. India moved well ahead of Pakistan and Bangladesh. Many households still also burn wood when cylinders run out, and outdoor air has not improved to match.
Source: WHO, via World Bank WDI.
The clean-air programme
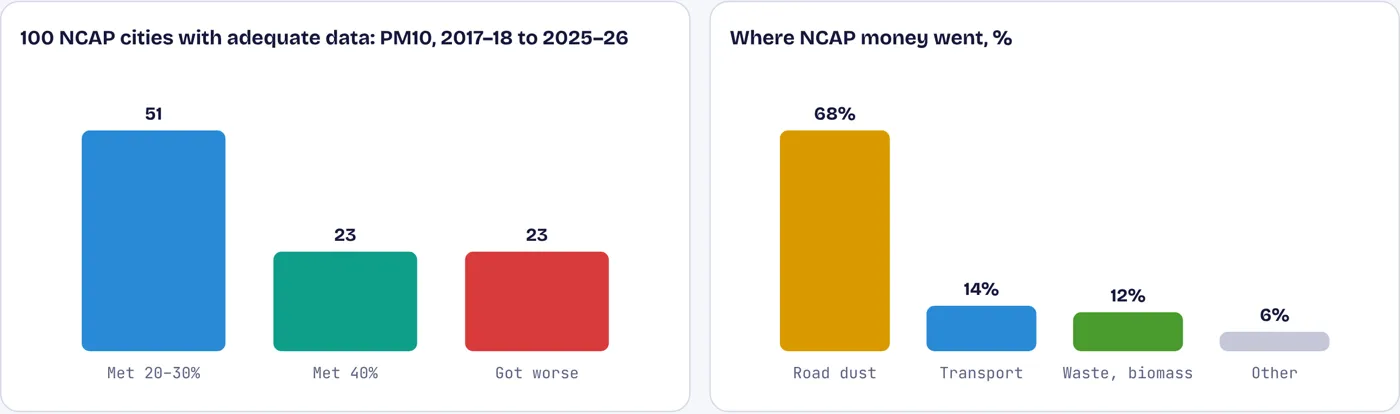
Most cities missed their clean-air targets; most money went on road dust
National Clean Air Programme (NCAP), launched 2019: results to 2025–26 in cities with adequate data, and how the money was spent
NCAP asked 130 cities to cut coarse dust (PM10) by 20–30% from 2017–18 levels, later raised to 40%. Of 100 cities with enough data, 23 met the 40% target and 23 got worse. Two-thirds of the money went to sweeping and sprinkling roads, while industry, vehicles and crop burning, among the main sources of the finest and deadliest particles, received far less.
Source: Centre for Research on Energy and Clean Air (CREA), Tracing the Hazy Air 2026.
Contested numbers
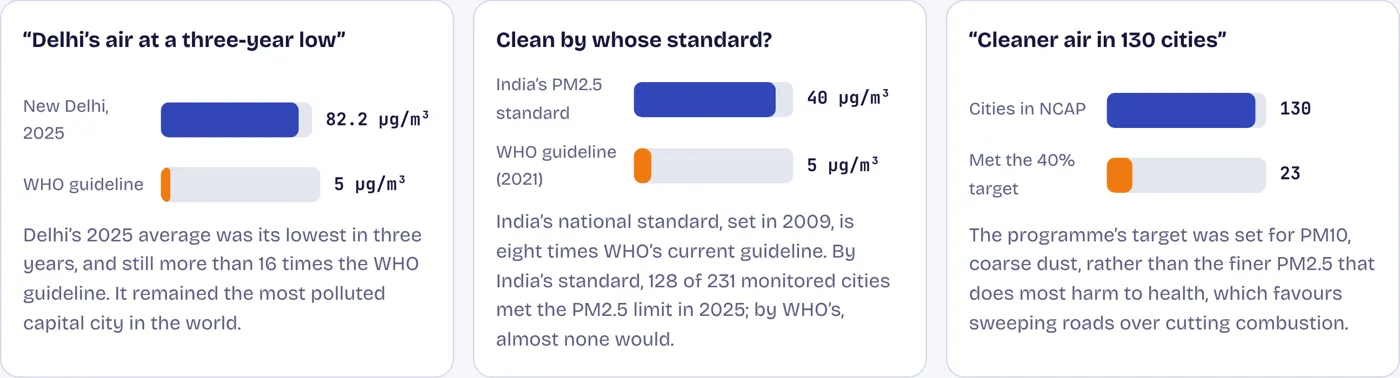
Three numbers that need a second look
Source: IQAir 2025; CREA 2026; WHO Air Quality Guidelines (2021); Central Pollution Control Board standards (2009).