The ledger
Nine claims, nine checks
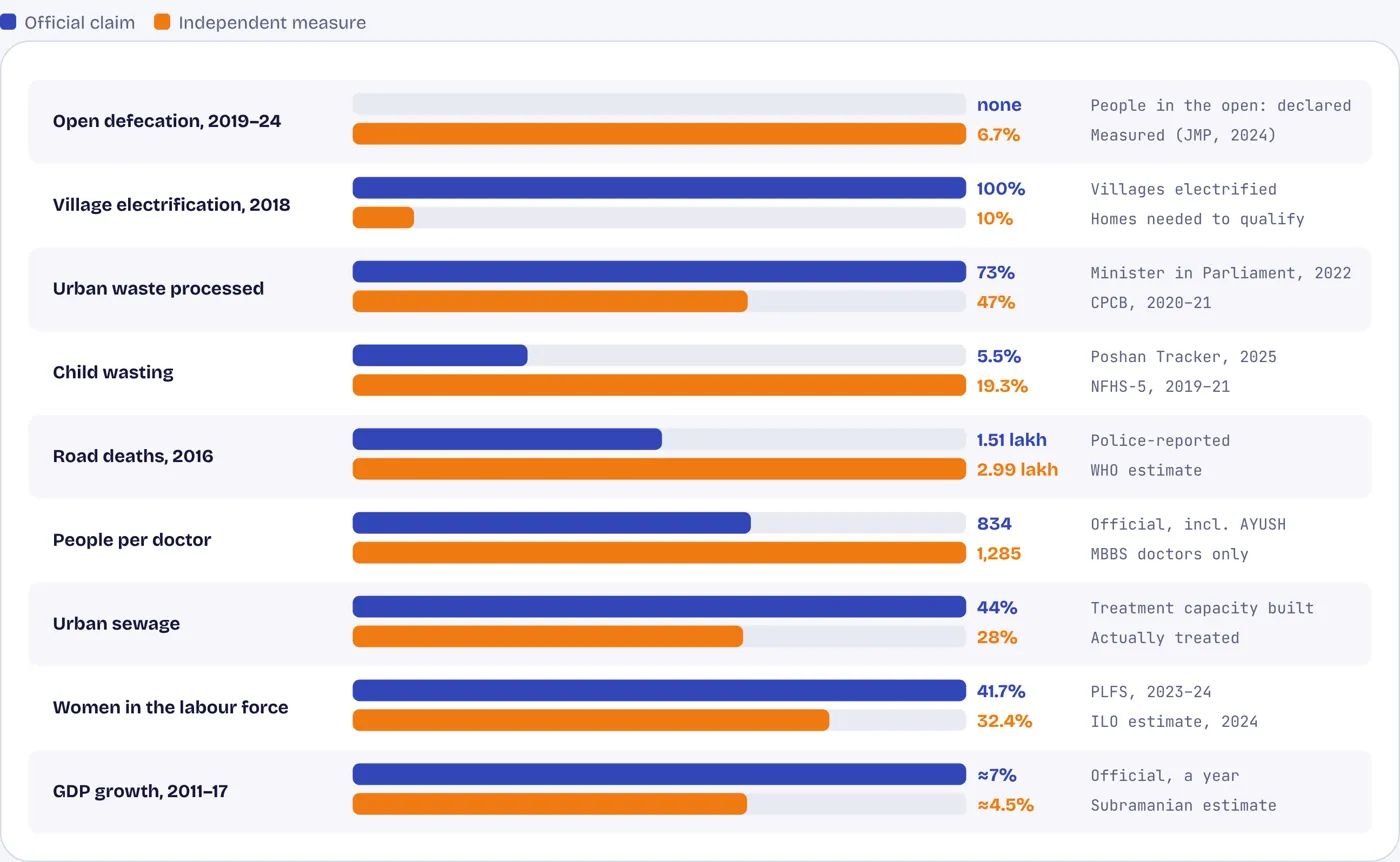
Each row compares an official figure with an independent or more complete measure of the same thing. Bars are scaled within each row. Tap or hover a bar.
Some gaps come from definitions: a village counted as electrified when a tenth of its homes had power, sewage counted as handled when a plant was built. Others come from what is counted: police records of road deaths, anganwadi registers for child wasting. In every case the official figure is the more flattering one.
Source: see the earlier chapters on each topic; MoHUA and CPCB via Scroll (waste); Arvind Subramanian, Harvard CID (2019), via The Wire (GDP).
Open defecation
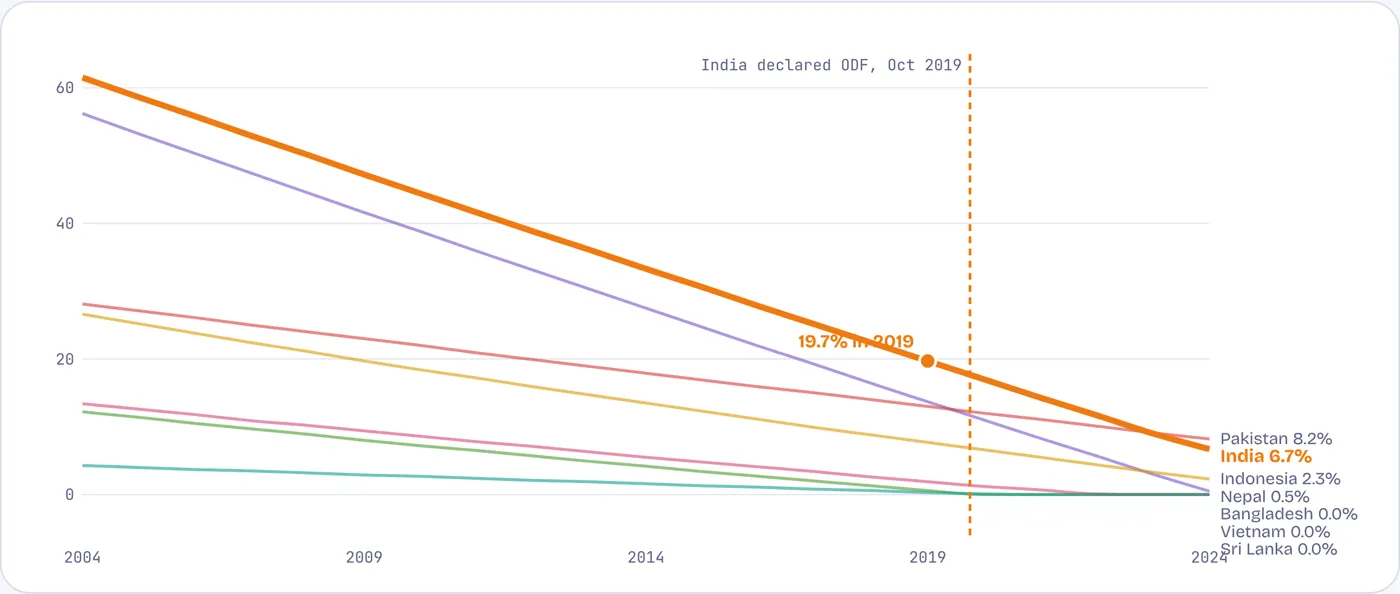
Nepal and India were both declared free of open defecation in 2019. Only Nepal got there.
People practising open defecation, % of population, 2004–2024 (WHO/UNICEF). Tap or hover a line.
India’s fall from 62% to under 7% is a real achievement. But the 2019 declaration came when about a fifth of Indians were still going in the open, and five years later one in fifteen still were, about ten crore people. Bangladesh, Vietnam and Sri Lanka reached zero quietly; Nepal reached almost zero after its own declaration.
Source: WHO/UNICEF Joint Monitoring Programme, via World Bank WDI.
Waste
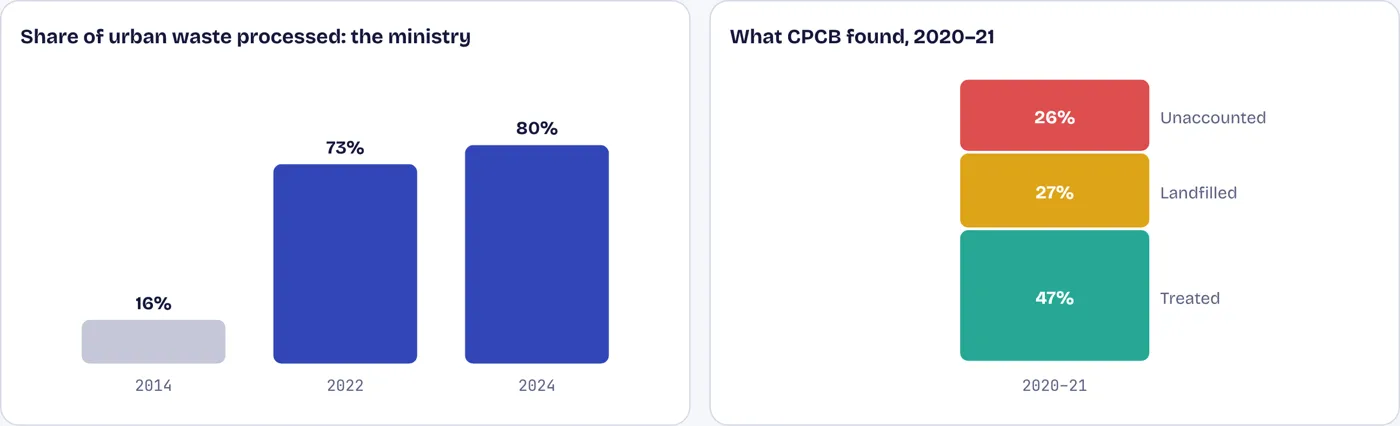
Three-quarters processed, according to the ministry; less than half, according to the pollution board
Urban solid waste: the ministry’s claim, and CPCB’s breakdown for 2020–21, % of waste generated
In 2022 a minister told Parliament that 73% of India’s solid waste was processed; by 2024 the ministry said 80%. The Central Pollution Control Board’s own report for 2020–21 found 47% treated, 27% dumped in landfills and a quarter not accounted for at all. The two count differently: the ministry adds up processing capacity and city claims; the board compiles what state pollution boards report as actually treated.
Source: Ministry of Housing and Urban Affairs and CPCB Annual Report 2020–21, via Scroll (August 2022); MoHUA data in Parliament, via iamrenew (2024).
The missing statistics
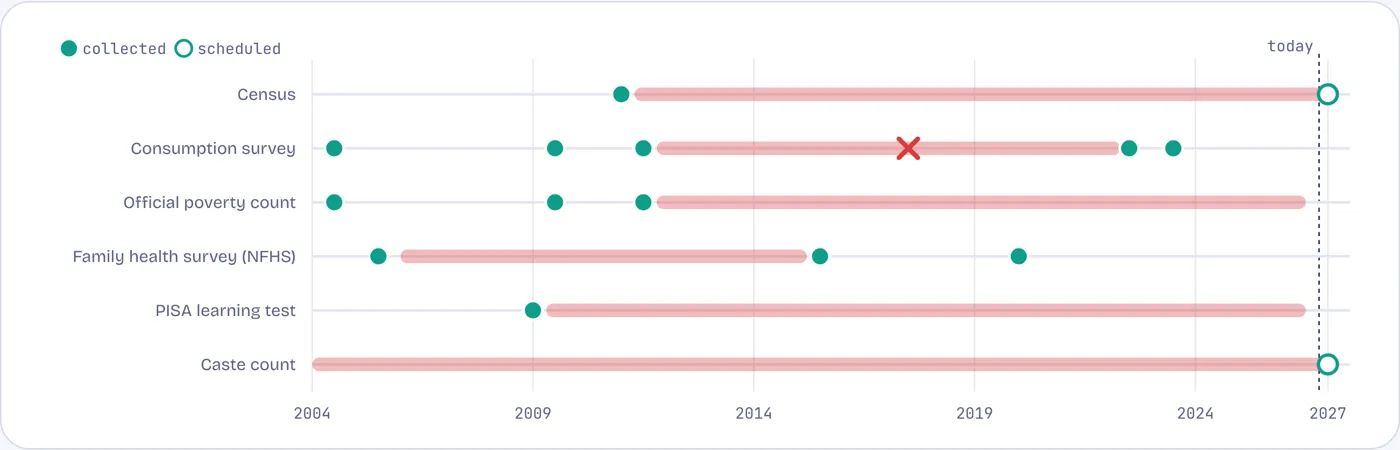
The surveys that could check the claims ran late, or did not appear
When key national statistics were collected, 2004–2027. Red bars show gaps; a cross marks data collected but withheld.
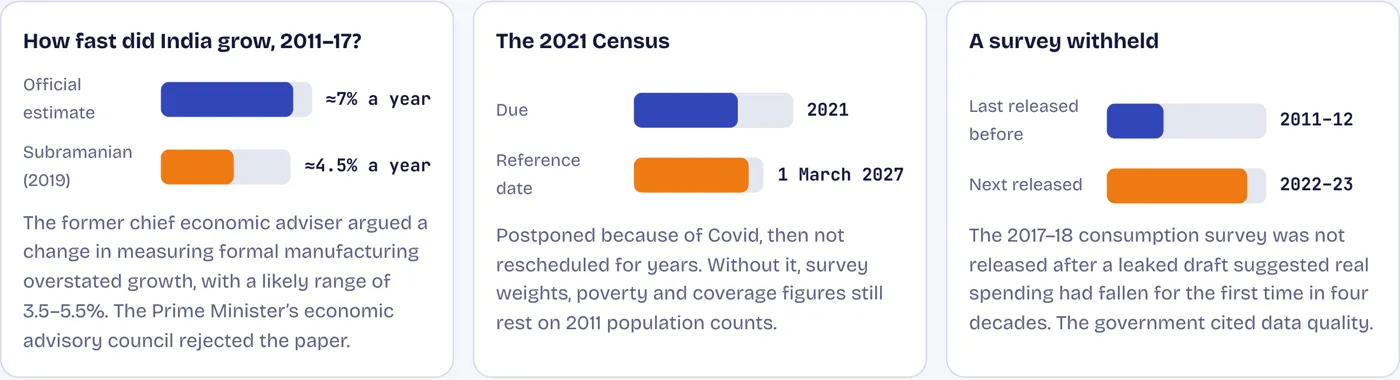
The Census due in 2021 was postponed and will count people on 1 March 2027, sixteen years after the last one. The 2017–18 consumption survey, which a leaked draft suggested showed falling rural spending, was withheld for “data quality” reasons. No official poverty count has been published since 2011–12. India left the OECD’s PISA learning test after 2009. Policy for a sixth of humanity has been run on old denominators.
Source: Registrar General of India notification, via The South First; MoSPI; NFHS reports; OECD PISA. The 2017–18 consumption survey was withheld in November 2019.
Rankings rejected
When outside measures disagreed, the response was often to reject the measure
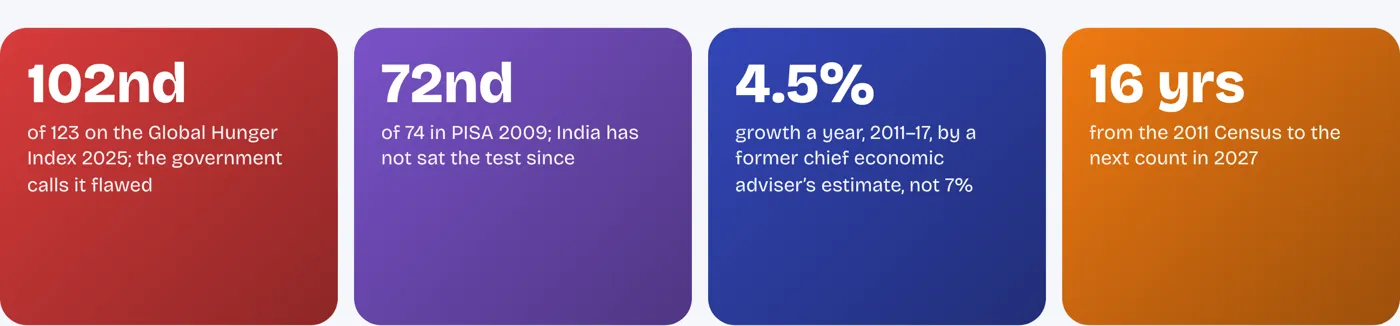
The government has called the Global Hunger Index flawed, attributed the 2009 PISA result to “out of context” questions, and had its economic advisers dismiss research suggesting growth was overstated. Some criticisms have merit, but the rejected numbers were rarely replaced with better ones.
Source: Global Hunger Index 2025; OECD PISA 2009+; EAC-PM response to Subramanian (2019), via The Week; Harvard CID.
Contested numbers
Three numbers that need a second look
Source: Arvind Subramanian (2019), via The Wire; Registrar General of India; The Quint (November 2019) on the withheld consumption survey.