On the best available estimates, the richest 1% of Indians now receive a larger share of national income than at any time in the past century, and hold two-fifths of its wealth. The strain shows less in riots than in who protests: landowning communities that once felt secure now march for job quotas.
A century of inequality
Income concentration fell for thirty years after independence, then rose past colonial levels
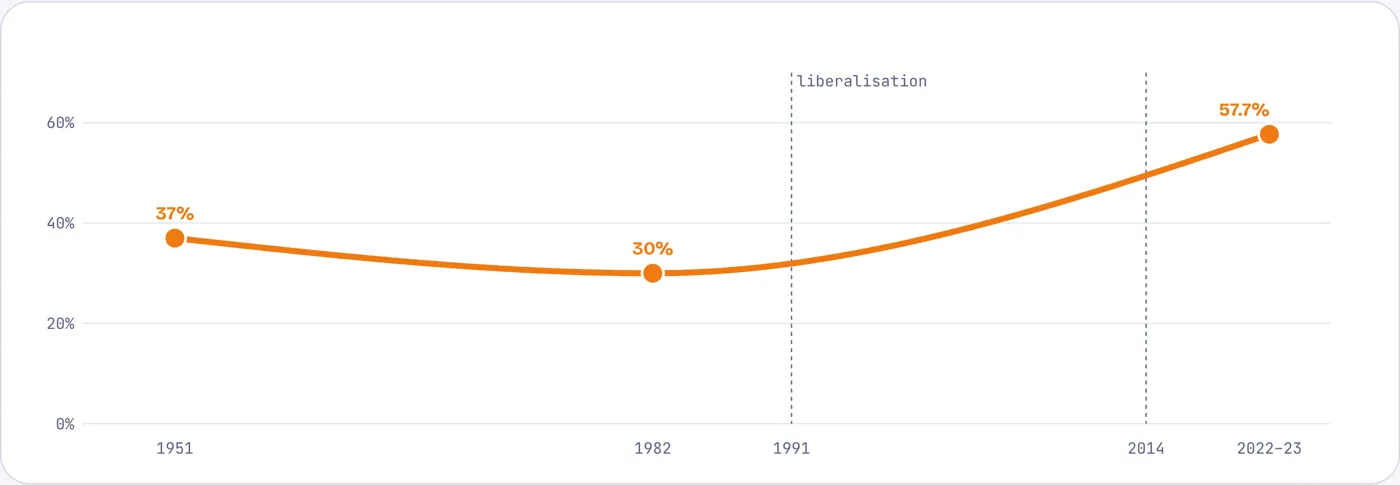
Share of national income going to the top 10%, India, selected years
The top tenth’s share fell from 37% in 1951 to 30% by 1982, under planning, high taxes and land reform. It has risen since liberalisation, and fastest after 2014, to about 58% in 2022–23. On this measure India’s top 1% now takes a larger share than in the United States, Brazil or South Africa.
Source: Bharti, Chancel, Piketty and Somanchi, “Income and Wealth Inequality in India, 1922–2023: The Rise of the Billionaire Raj”, World Inequality Lab (2024), as reported by Madhyamam. Only the three published points are plotted; the line joins them.
Who gets what
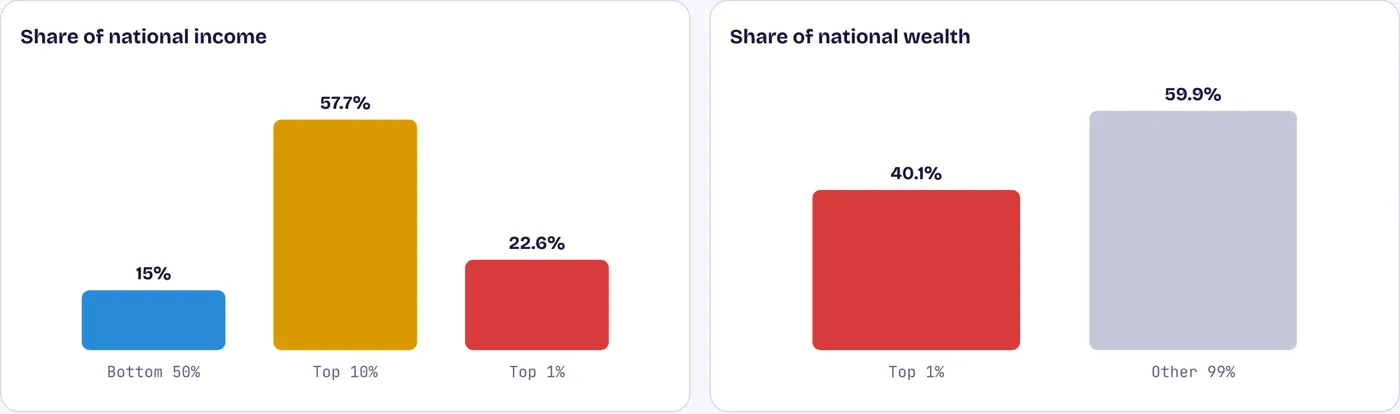
The top 1% earn 23 times the average Indian; the bottom half share 15%
Share of national income and of wealth, 2022–23
The poorer half of Indian adults, some 46 crore people, receive about 15% of national income. The top 1%, about 90 lakh adults, receive 22.6% and own 40% of the wealth. Their average income, about ₹53 lakh a year, is 23 times the national average.
Source: World Inequality Lab (2024), as above.
Two pictures
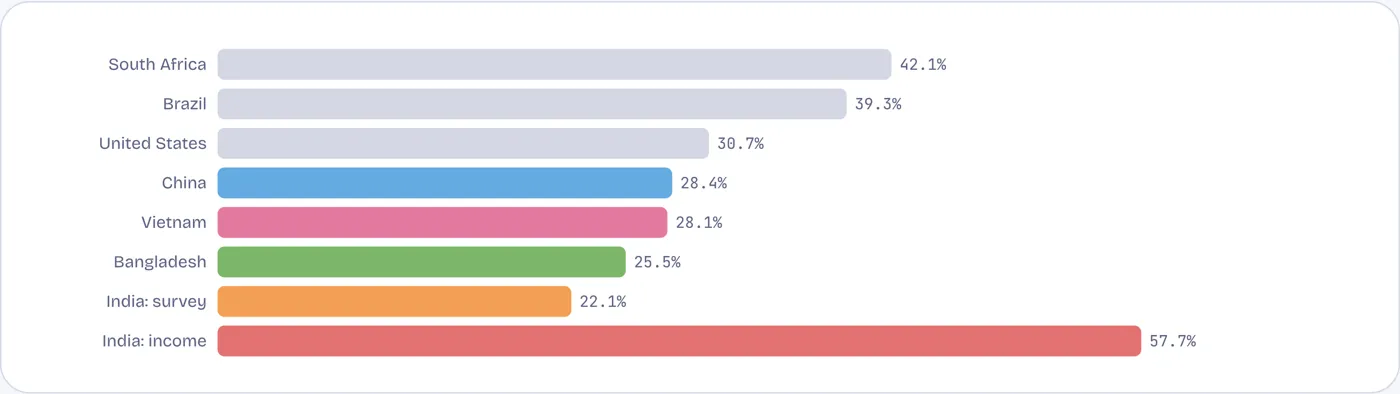
Household surveys show India as one of the more equal countries; income and tax records show the opposite
Share of the top 10%, latest year: household surveys for all countries (World Bank), and India’s share of national income from tax and national accounts (World Inequality Lab)
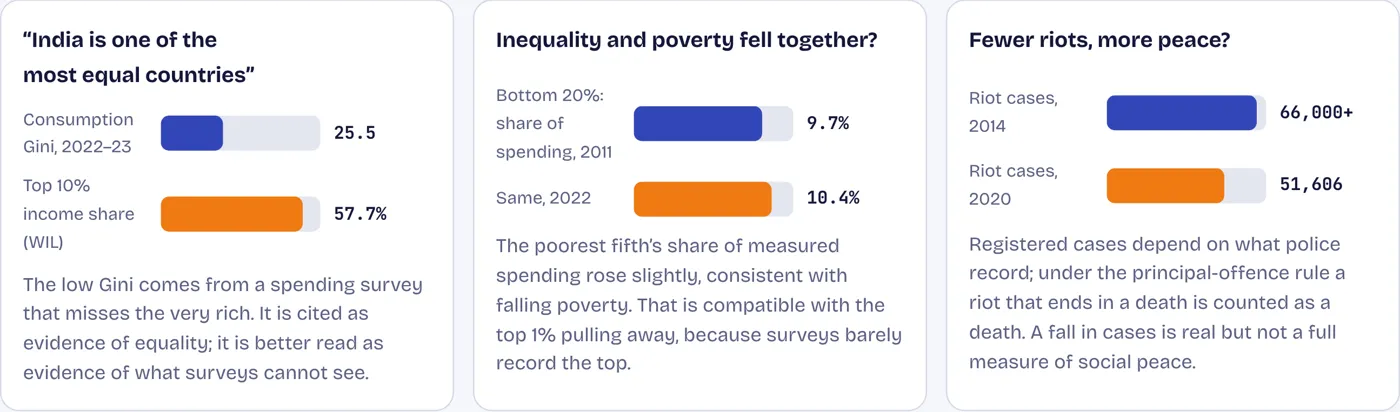
The government’s consumption survey puts India’s Gini coefficient at 25.5 in 2022–23, among the lowest in the world, with the top tenth accounting for 22% of spending. Surveys measure spending, not income, and miss most of the very rich, who neither answer surveys nor spend most of what they earn. Tax and national-accounts data capture them, and show a top tenth with 58% of income. Both can be true; only one describes who is pulling ahead.
Source: World Bank WDI (survey-based Gini and top-decile share, 2022); World Inequality Lab (2024).
The very top
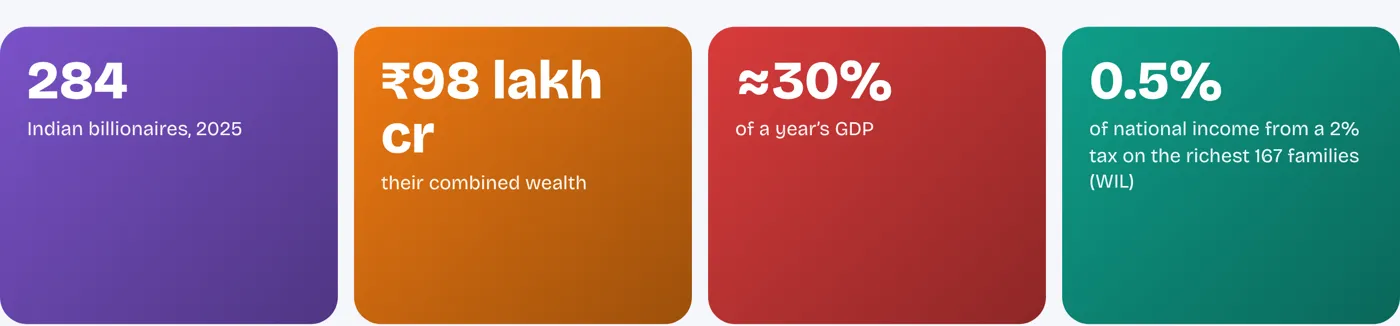
284 billionaires hold wealth worth almost a third of India’s annual output
Hurun counted 284 Indian billionaires in 2025, with combined wealth of ₹98 lakh crore, about 30% of a year’s GDP. A 2% annual tax on the net wealth of the 167 richest families alone would, the World Inequality Lab estimates, raise about 0.5% of national income, more than a third of what India’s governments spend on public health in a year.
Source: Hurun Global Rich List 2025, via IANS; World Inequality Lab (2024); GDP from World Bank WDI.
Where the strain shows
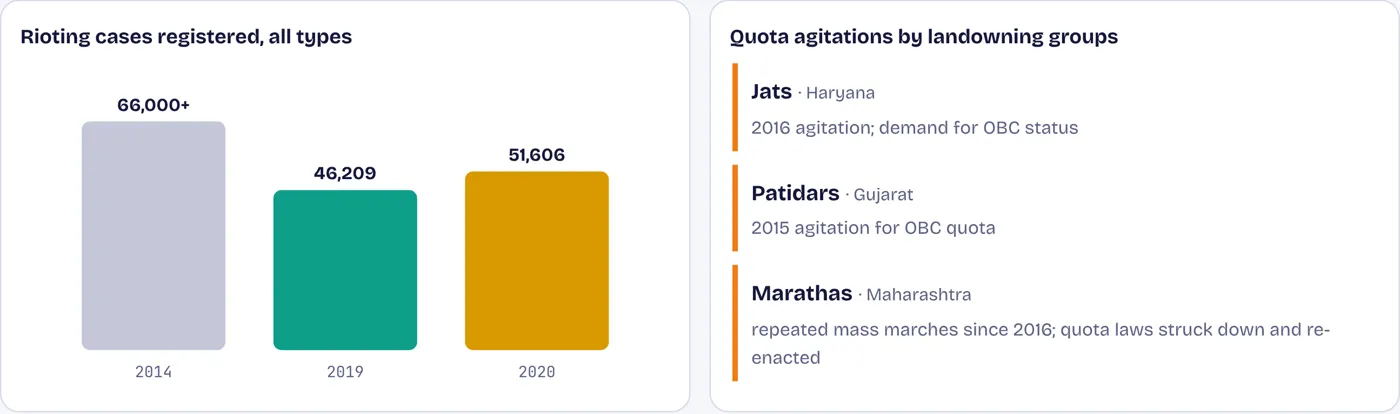
Recorded riots fell; protests by prosperous groups for quotas grew
Rioting cases registered by police, 2014–2020, and quota agitations by landowning groups
Inequality has not, on police records, brought more rioting: registered riot cases fell by about 30% between 2014 and 2019, though they rose again in 2020 with the Delhi violence. The strain shows elsewhere. Jats in Haryana, Patidars in Gujarat and Marathas in Maharashtra, traditionally landowning and politically powerful, have mounted mass agitations to be classed as backward for quotas in government jobs and colleges. Their grievance is not destitution but falling behind: farm incomes stagnant, and too few good jobs for their children.
Source: NCRB, Crime in India, via Factly; Shankar IAS Parliament on “competitive backwardness” (2017); ORF.
Contested numbers
Three numbers that need a second look
Source: World Bank WDI; World Inequality Lab (2024); NCRB via Factly.
The takeaway
Growth that pools at the top weakens the bargain that holds a diverse democracy together: that effort pays and the system is fair. India’s strains show as quota fights and resentment more than riots, but they are a warning, not a fixed state.