Growth without jobs
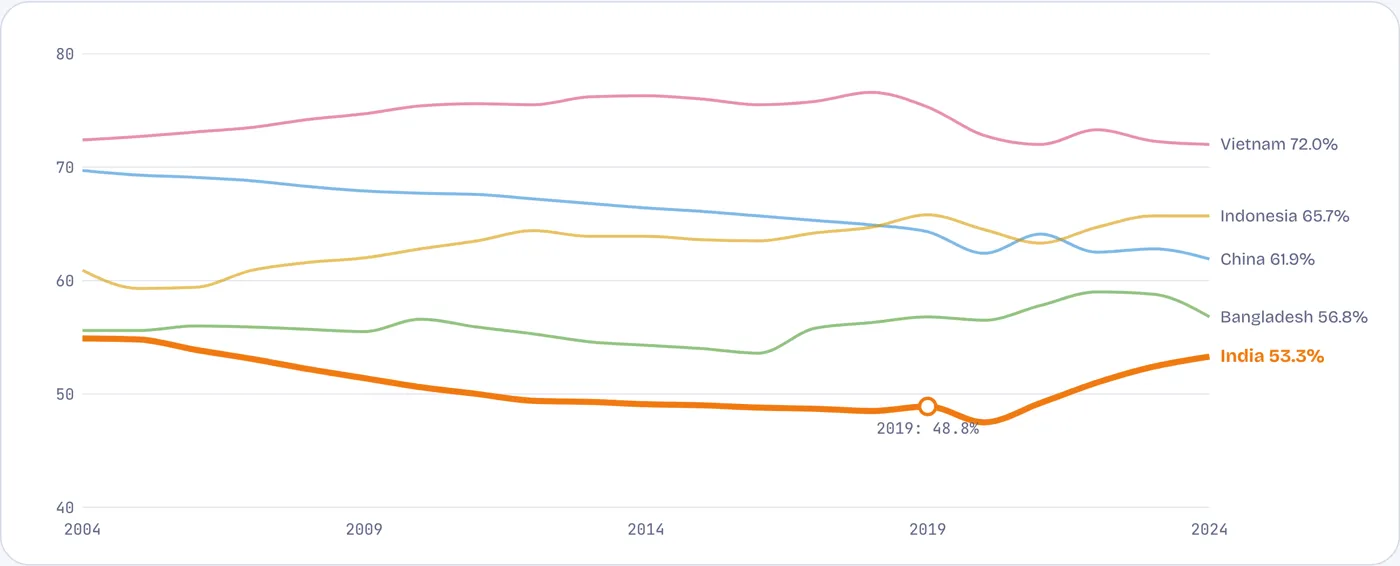
India’s share of adults in work fell for fifteen years of fast growth
Employment-to-population ratio, % of people aged 15+, 2004–2024 (ILO estimates). Tap or hover a line.
Between 2004 and 2019 the share of Indian adults with any work fell from 55% to 49%, mostly as women left the labour force. It recovered after 2020, to 53%, but largely through self-employment and unpaid work on family farms, the kind of work people take when there is nothing better. Vietnam and China keep around two-thirds or more of adults in work.
Source: ILO modelled estimates, via World Bank WDI.
The kind of work
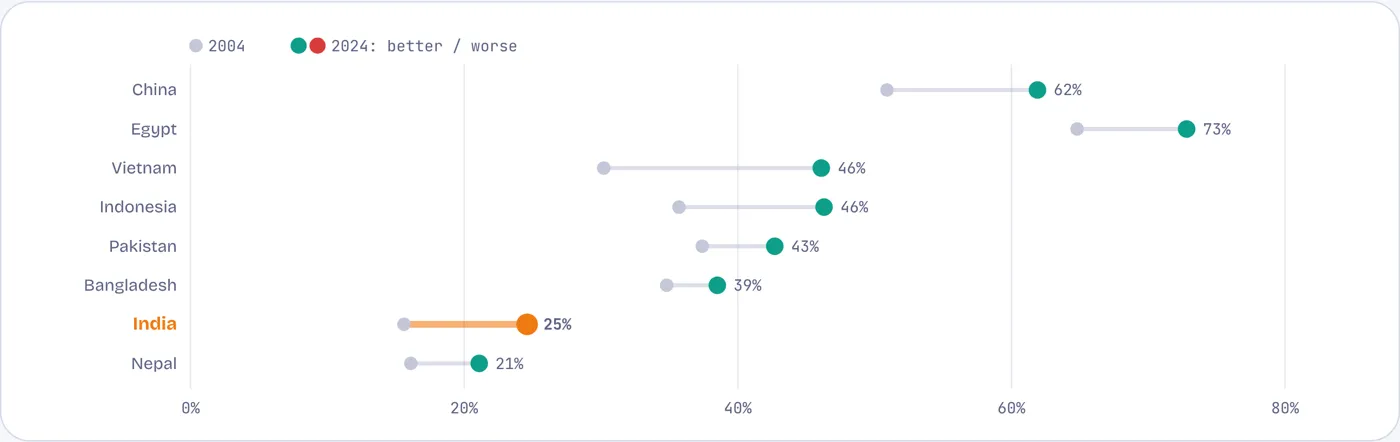
Only one Indian worker in four earns a regular wage or salary
Wage and salaried workers, % of all employed, 2004 → 2024. Tap or hover a row.
The share of Indian workers on wages rose from 16% to 25% in twenty years, still the lowest in the panel apart from Nepal. In China six workers in ten draw a wage; in Vietnam nearly half. About 90% of Indian workers are in informal jobs without a contract, paid leave or social security.
Source: ILO modelled estimates, via WDI; ILO and Institute for Human Development, India Employment Report 2024, via Drishti IAS.
Educated and jobless
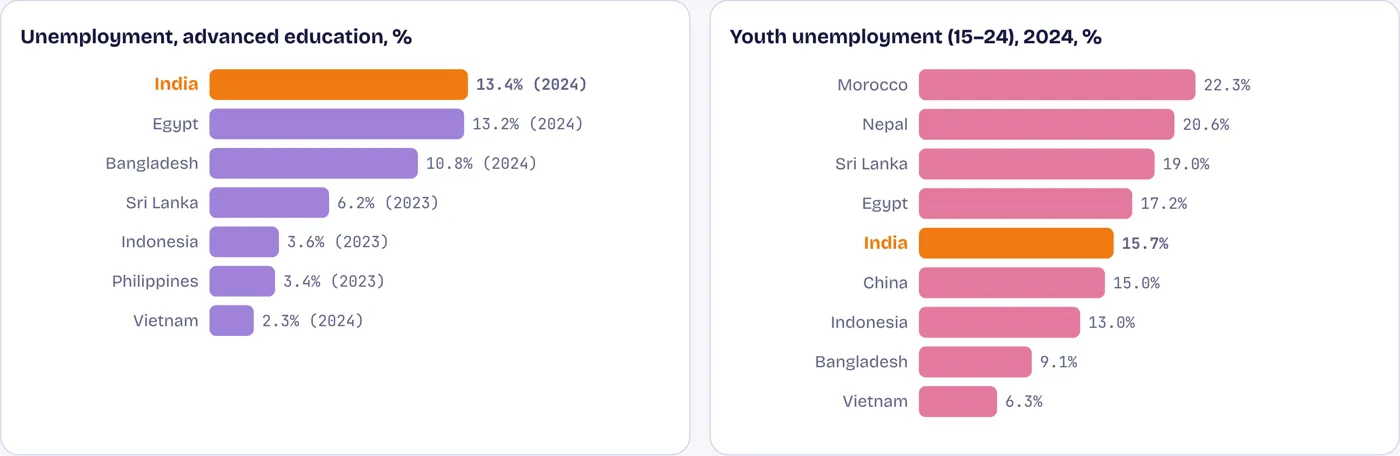
The more education a young Indian has, the likelier they are to be unemployed
Unemployment among people with advanced education (graduates and above), %, latest year; and youth unemployment, 15–24
One Indian graduate in eight looking for work cannot find it, against fewer than one in twenty in Vietnam, Indonesia and the Philippines. Young people make up 83% of India’s unemployed, and the share of the unemployed with at least secondary education nearly doubled, from 35% in 2000 to 66% in 2022. Education raised expectations faster than the economy created jobs to meet them.
Source: ILO estimates via WDI; India Employment Report 2024.
The queue for government jobs
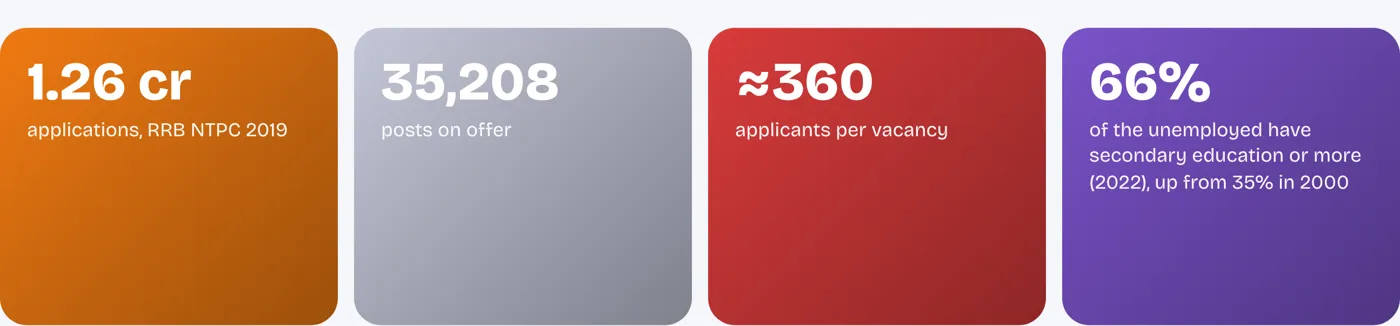
1.26 crore applications for 35,208 railway jobs
When good private jobs are scarce, the queue forms at the government’s door. The 2019 recruitment for non-technical railway posts drew about 1.26 crore applications, some 360 for every vacancy.
Source: PaGaLGuY on RRB NTPC 2019; India Employment Report 2024.
Jobs per point of growth
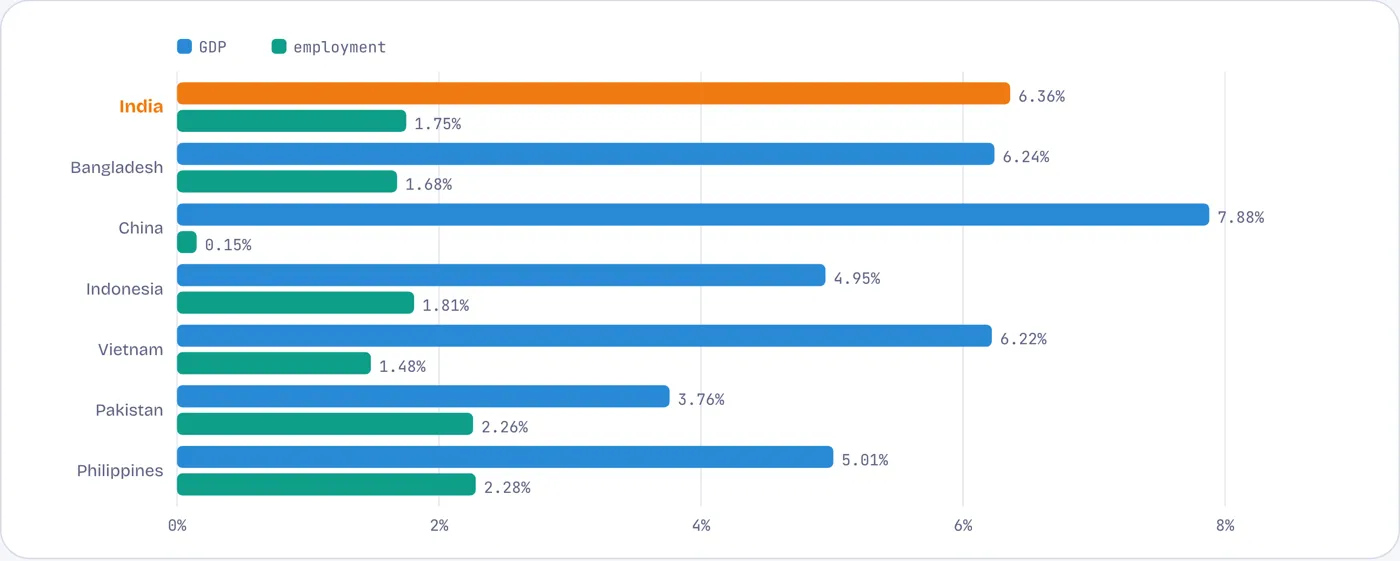
India’s growth created jobs at a similar rate to its peers; its problem is quality and who is left out
Average yearly growth of GDP and of employment, 2004–2024, %
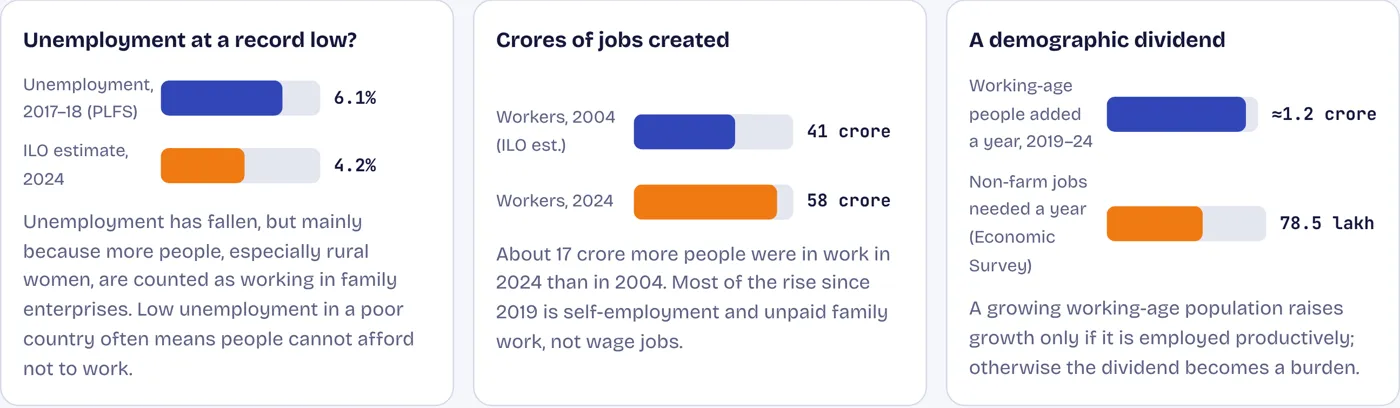
Measured simply, India’s employment grew about 1.75% a year against GDP growth of 6.4%, a ratio close to Bangladesh’s and Vietnam’s. The number of Indians in work rose from about 41 crore to 58 crore. “Jobless growth” in India is less an absence of jobs than an absence of good ones: too few wage jobs in factories and offices, too many people in farming and petty self-employment, and women left out.
Source: Calculated from World Bank WDI (GDP, constant prices; labour force and unemployment, ILO estimates).
Contested numbers
Three numbers that need a second look
Source: MoSPI PLFS; ILO via WDI; India Employment Report 2024.