India crossed the line demographers use for an ‘ageing society’ in 2024, with 7% of its people over 65, at an income of about $2,400 a head. Japan and South Korea crossed it at six to seven times that. Births are already below replacement. The window in which a young workforce can make India rich is open now, and it narrows within a generation.
Rich or old first?
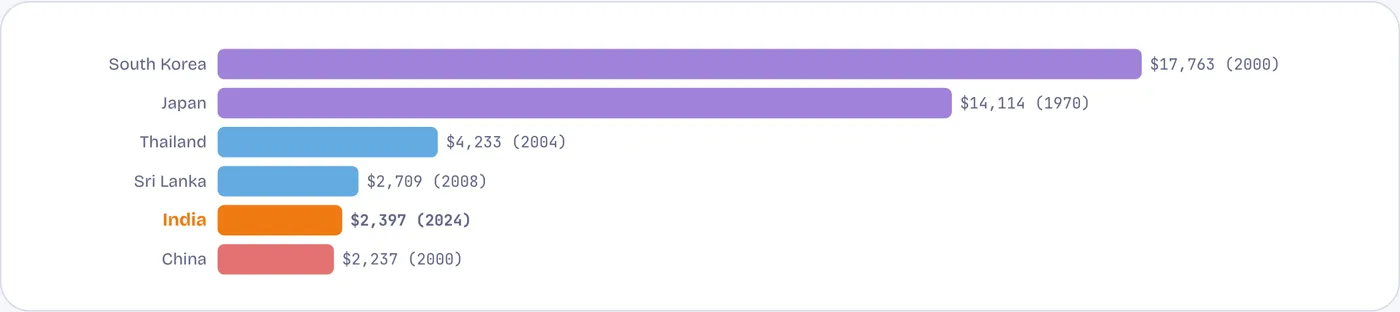
India has started ageing at a fraction of the income at which East Asia did
GDP per person (constant 2015 US$) in the year the 65+ share first reached 7% of the population
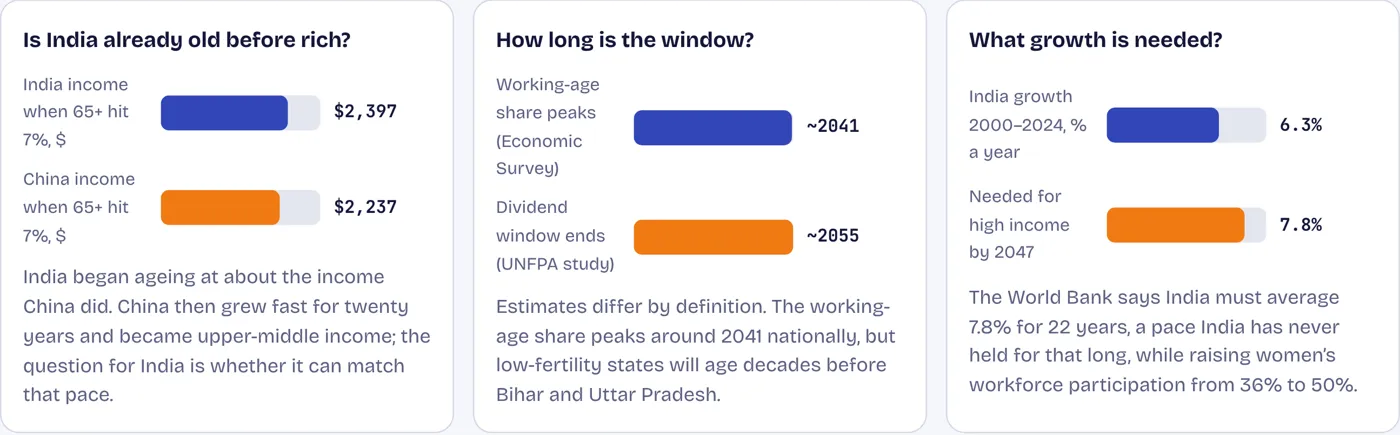
Japan began ageing as a rich country, South Korea as an upper-middle one. India reached the same point at about the income China had in 2000. China then ran two decades of 8–10% growth and still reached 14% elderly, an ‘aged society’, at about $12,500 a head, well short of high income. India would need to do better than China did.
Source: calculated from World Bank WDI (SP.POP.65UP.TO.ZS, NY.GDP.PCAP.KD).
The curve
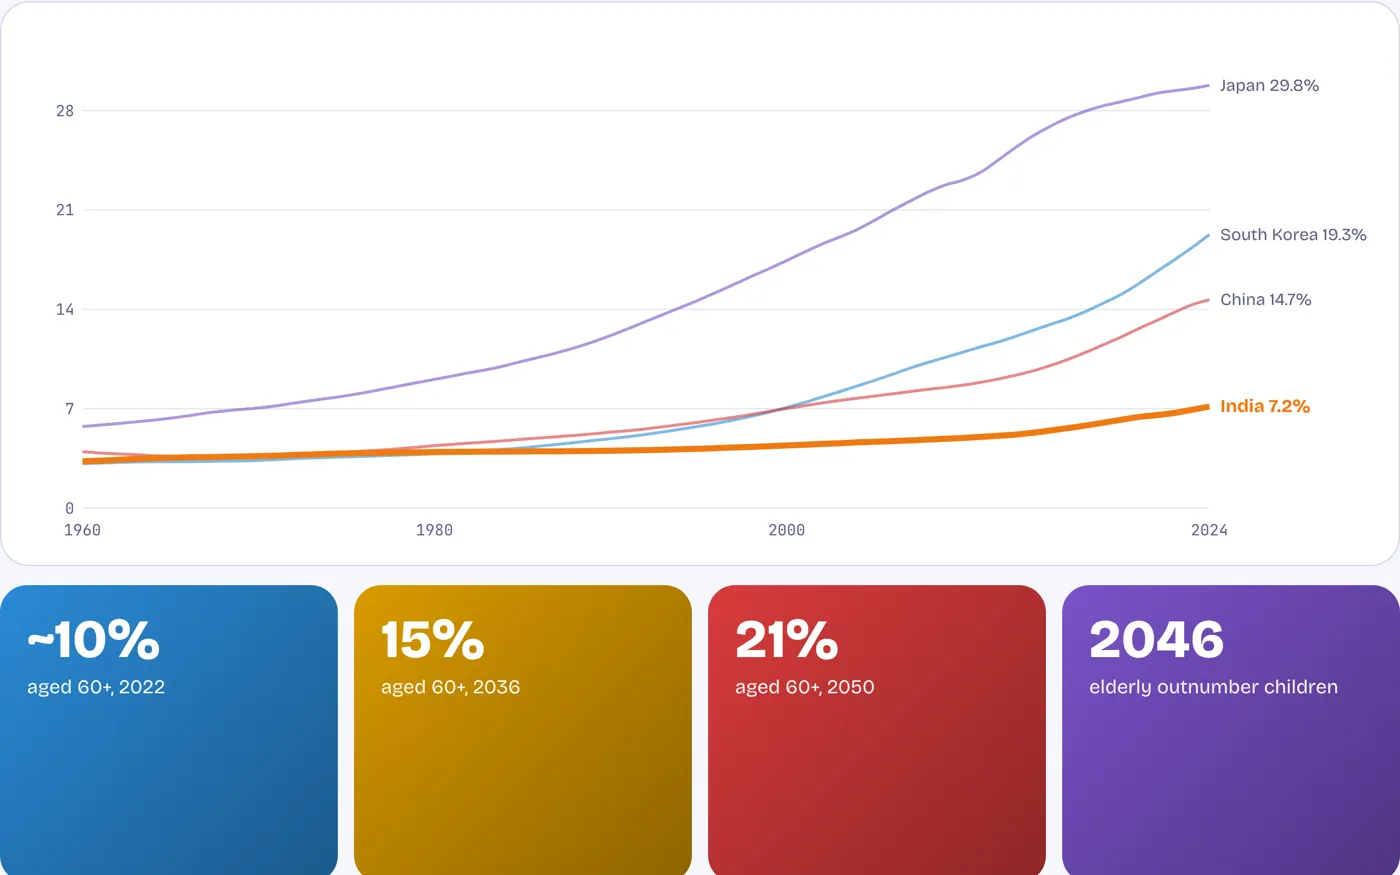
India’s ageing has begun where China’s stood in 2000
Population aged 65 and over, % of total, 1960–2024. Tap or hover a line.
China went from 7% elderly in 2000 to 14% in 2023. India is on a slower but similar path: UNFPA projects the share aged 60 and over to rise from about a tenth in 2022 to 15% by 2036 and 21% by 2050, when one Indian in five will be over 60. From around 2046 there will be more elderly Indians than children.
Source: World Bank WDI; UNFPA India Ageing Report 2023, via Factly and Outlook.
The births
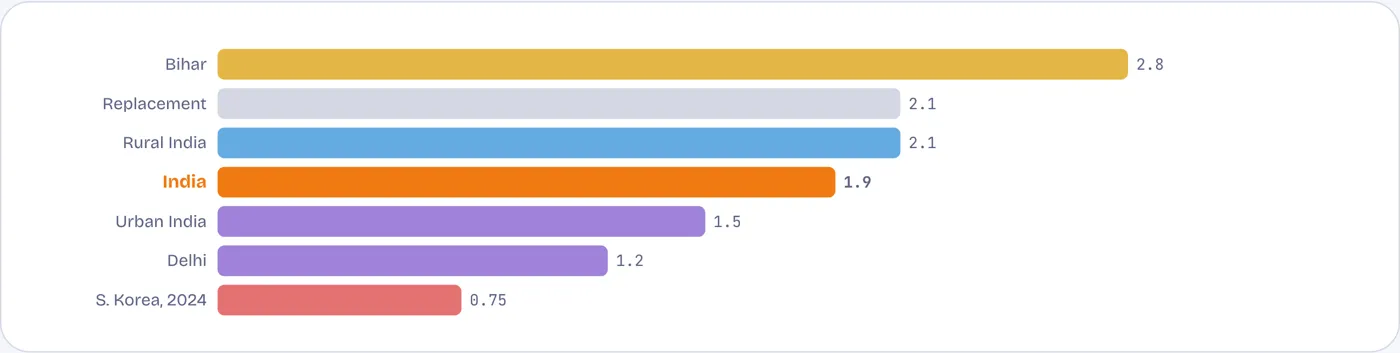
Fertility has fallen below replacement, fastest in the richer states and cities
Total fertility rate, births per woman, Sample Registration System 2023
India’s fertility is 1.9, below the 2.1 needed to replace each generation. Urban women average 1.5 children; Delhi 1.2, close to South Korea’s levels a decade ago. Only Bihar and a few northern states remain well above replacement. The south and west will age first and fastest, while the young population of the north still needs jobs.
Source: Registrar General of India, SRS Statistical Report 2023, via C4S.
The race
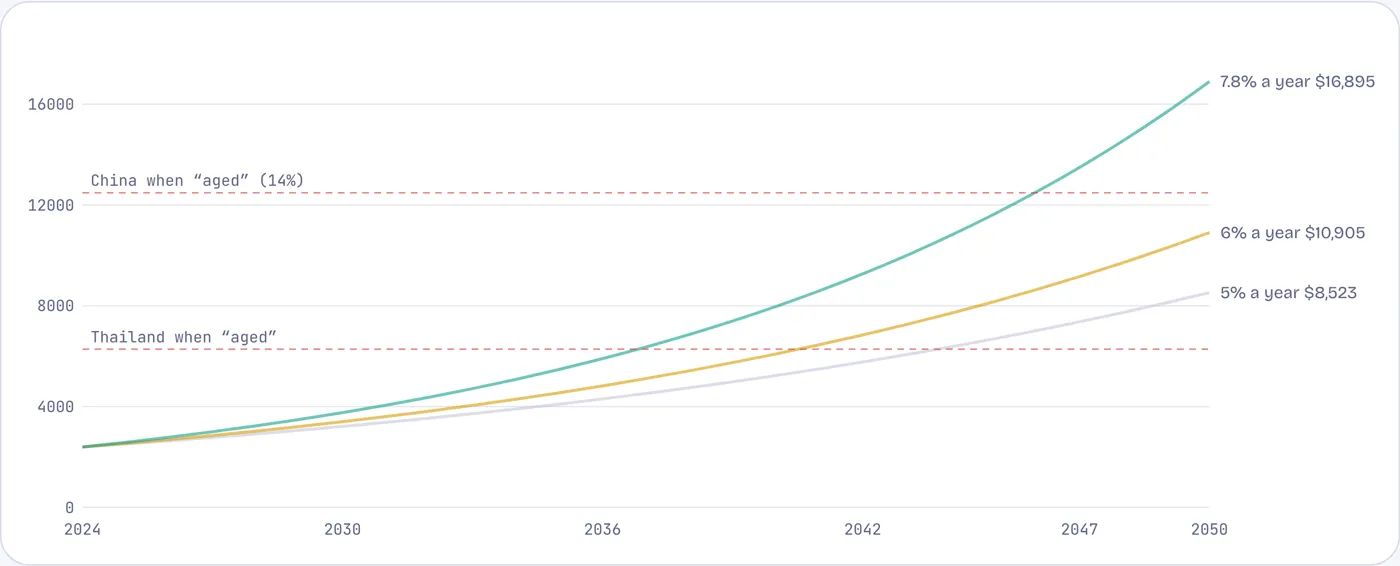
At past growth rates, India reaches China’s ‘aged’ income only in the 2050s
India’s GDP per person, constant 2015 US$, at three steady growth rates of income per person, 2024–2050 (illustration)
At 5% a year, roughly India’s pace in the last two decades, income per person would reach about $8,500 by 2050, still below what China earned when it turned ‘aged’. At 7.8% a year, the pace the World Bank says India’s whole economy needs to be high-income by 2047, it would reach about $13,500 by 2047. The elderly share will keep rising whichever line India follows.
Source: calculated from World Bank WDI (2024 base); World Bank, Becoming a High-Income Economy in a Generation (2025). The World Bank’s 7.8% refers to GDP; per-person growth would be slightly lower.
Who looks after them
Most elderly Indians have no pension and many have no income
India’s elderly, latest survey data
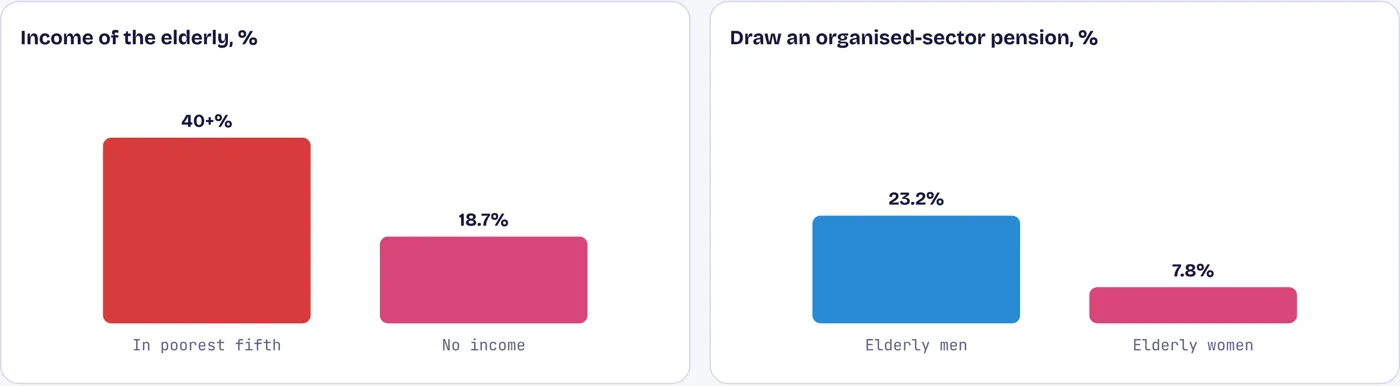
More than 40% of India’s elderly are in the poorest fifth of households, and nearly one in five has no income of their own. Only one in four elderly men and fewer than one in twelve elderly women who worked in the organised sector draw a pension. The central old-age pension is ₹200 a month, unchanged since 2007. Women live longer, are more often widowed, and are the poorest of the old.
Source: UNFPA India Ageing Report 2023 via Outlook; LASI Wave 1 (2017–18) via ORF, “Old, Frail and Poor” (2025).
The window
The share of dependants has fallen to its lowest; from here it turns
Dependants (under 15 and over 64) per 100 people of working age, 1960–2024
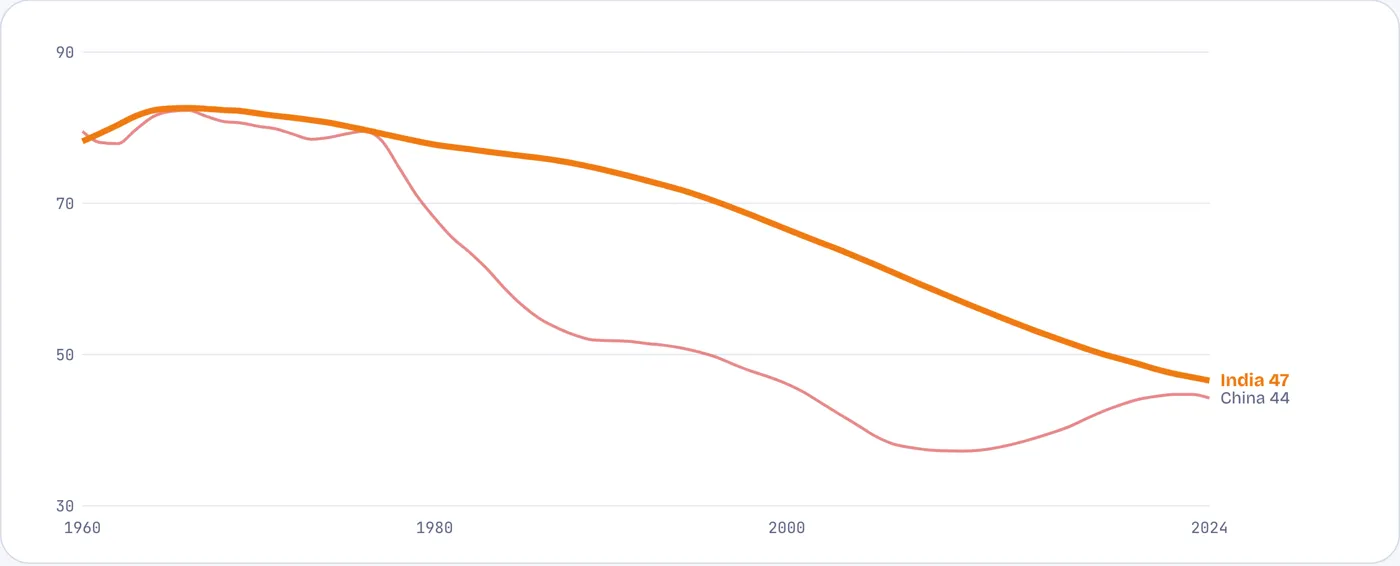
India has never had fewer dependants per worker than today. The Economic Survey of 2018–19 projected the working-age share to peak around 2041. That gain counts only if the extra workers have jobs: with women’s workforce participation around a third and most work informal, much of the dividend is going unused.
Source: World Bank WDI (SP.POP.DPND); Economic Survey 2018–19 via Drishti IAS.
Contested numbers
Three numbers that need a second look
Source: World Bank WDI; UNFPA; Drishti IAS; World Bank (2025).
The takeaway
India has begun to age while still lower-middle income. Unless growth runs faster than ever before and puts women and the young to work now, it will be old long before it is well-off, and the old-age safety net, at ₹200 a month, is not ready.