The shrinking share
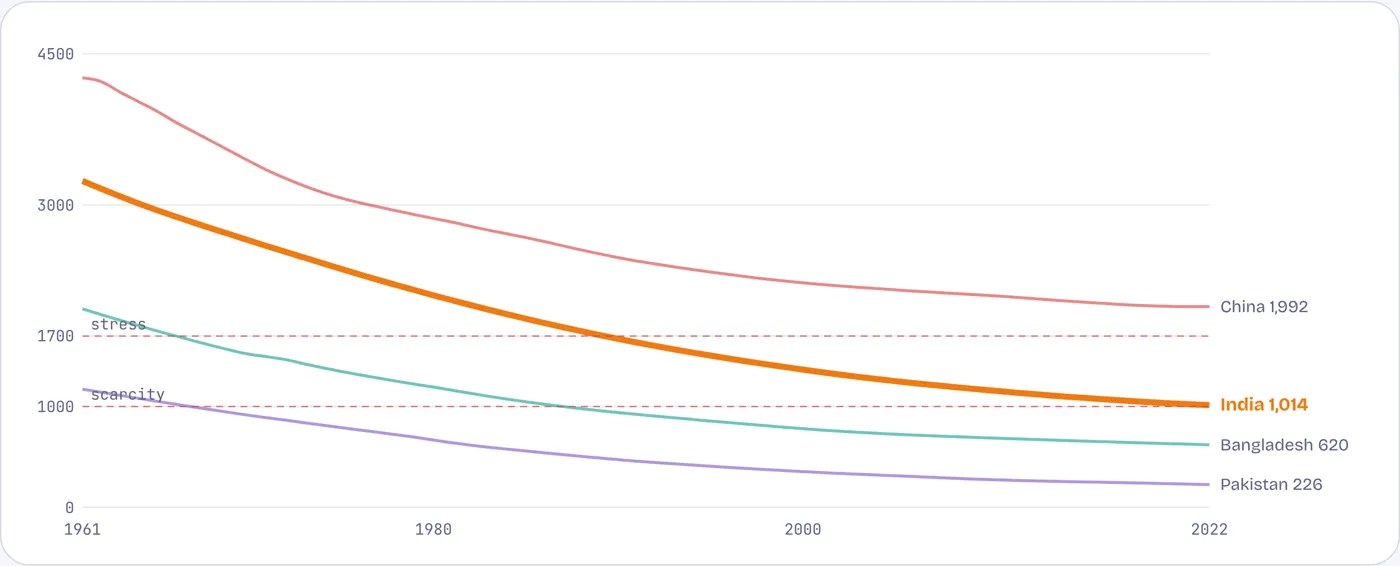
Water per person crossed the stress line around 1990 and is nearing scarcity
Internal renewable freshwater per person, cubic metres a year, 1961–2022. Tap or hover a line.
Rain and rivers have not changed much; the number of people sharing them has. India fell below 1,700 m³ per person, the usual threshold of water stress, around 1990, and is now close to 1,000 m³, the threshold of scarcity. China has about twice India’s water per person; Pakistan, which depends on the Indus, has a fifth.
Source: FAO AQUASTAT via World Bank WDI (ER.H2O.INTR.PC). Thresholds: Falkenmark water stress index.
Who uses it
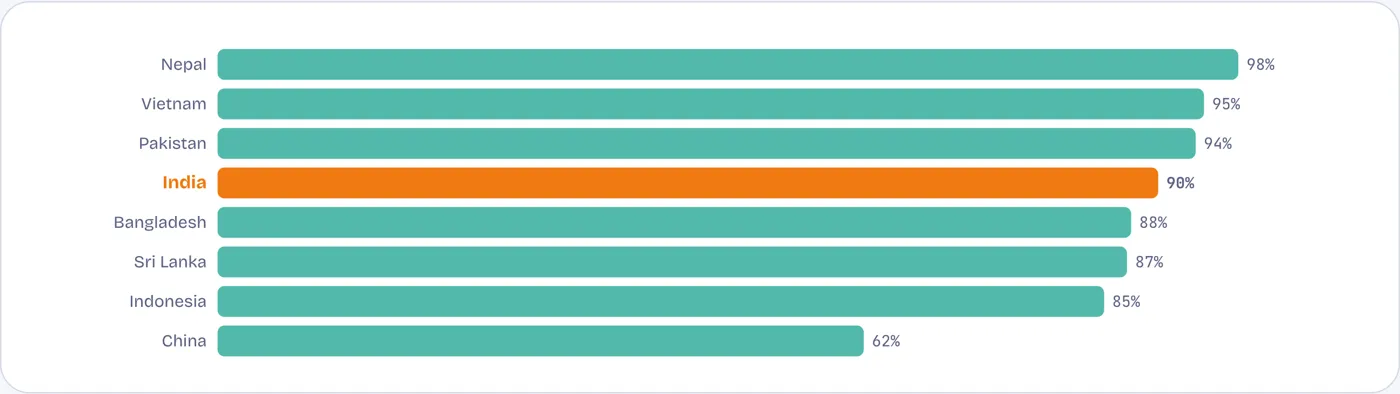
Farms take nine of every ten litres India withdraws
Agriculture’s share of annual freshwater withdrawals, %, 2022
Industry and households share the last tenth. China has cut agriculture’s share to 62% as factories and cities grew; India’s has barely moved from 93% in 1975. Any lasting fix to India’s water runs through its fields.
Source: FAO AQUASTAT via World Bank WDI (ER.H2O.FWAG.ZS).
What it earns
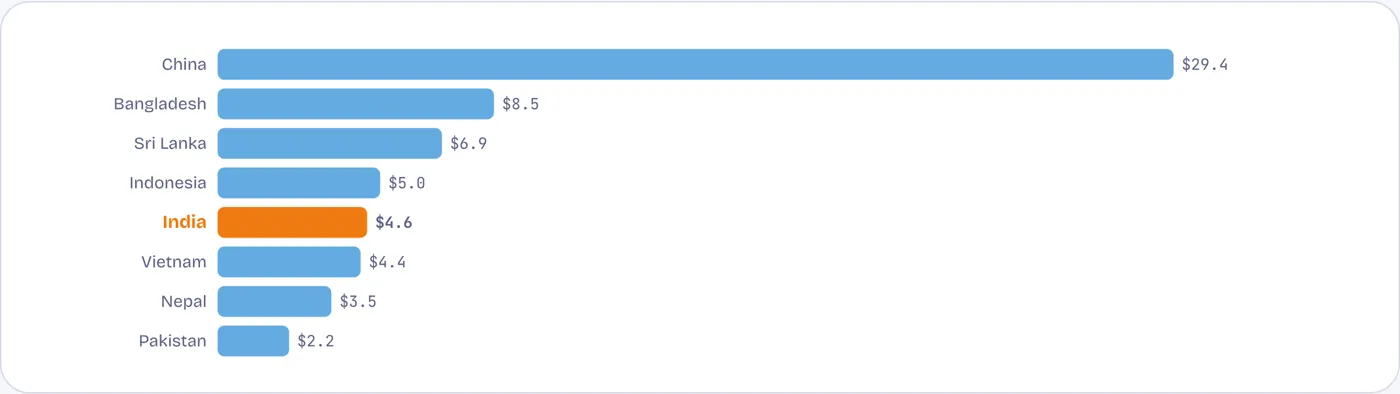
Each cubic metre of water produces a sixth of the output it does in China
GDP per cubic metre of freshwater withdrawn, constant 2015 US$, 2022
India earns $4.6 of GDP for every cubic metre it draws. China earns $29, Bangladesh $8.5. Low water productivity is the mirror of a farm-heavy economy that floods paddy fields with nearly free water and power.
Source: World Bank WDI (ER.GDP.FWTL.M3.KD).
Under the ground
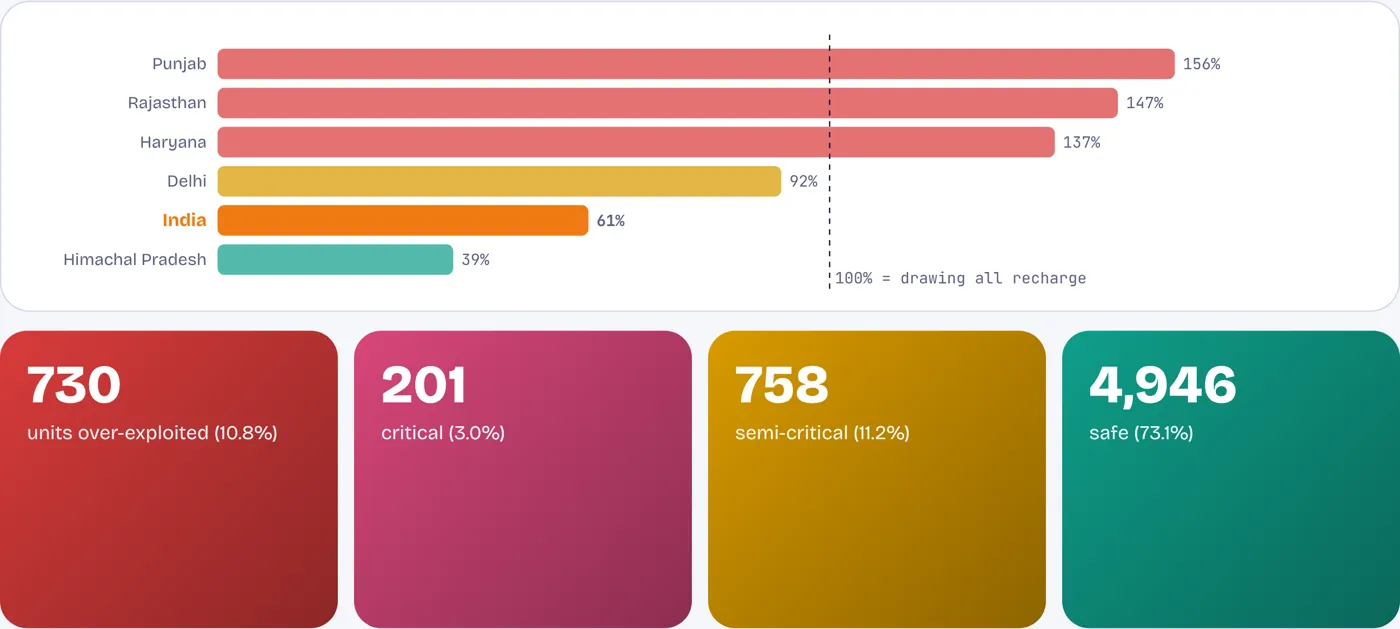
Three northern states pump out far more groundwater than rain puts back
Stage of groundwater extraction: annual extraction as % of annual extractable recharge, 2025. Above 100% the aquifer is shrinking.
Nationally, India draws 61% of its renewable groundwater, a figure that has eased slightly since 2017. The average hides the hotspots: Punjab draws 156%, Rajasthan 147% and Haryana 136%. One assessment unit in four is over-exploited, critical or semi-critical.
Source: CGWB and states, Dynamic Ground Water Resources of India 2025, via Rajya Sabha reply reported by ETV Bharat; Vision IAS.
From pipe to glass
Taps reached four in five rural homes; safe, regular water reached fewer
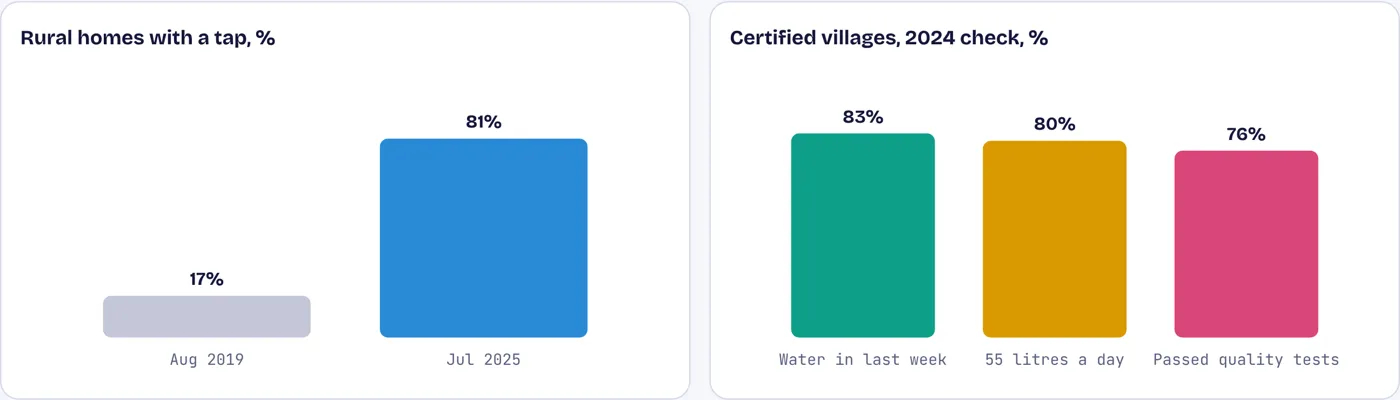
Jal Jeevan Mission: rural households with a tap connection, and a 2024 check of certified villages
Rural tap coverage rose from about 17% in 2019 to 81% by mid-2025, one of the fastest piped-water roll-outs anywhere. But a government-commissioned survey of villages already certified as fully served found 83% of households got water in the previous week, 80% got the promised 55 litres a person, and only 76% of samples passed basic quality tests.
Source: Ministry of Jal Shakti, Lok Sabha reply (July 2025) via IANS; IPSOS functionality assessment 2024 via SuperKalam/The Hindu.
Contested numbers
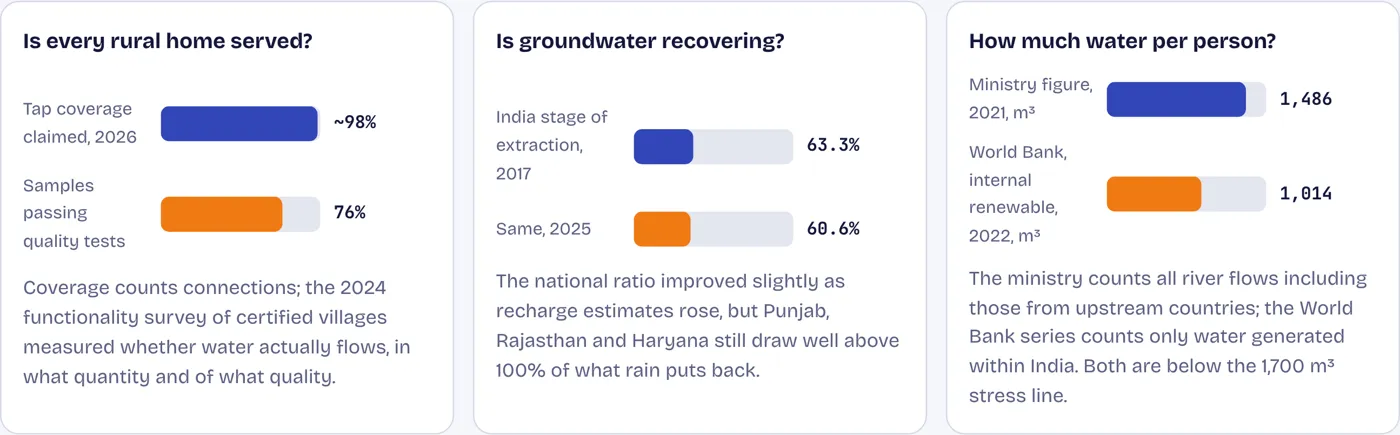
Three numbers that need a second look
Source: Ministry of Jal Shakti; CGWB; World Bank WDI; Lok Sabha replies.