Size of the economy, 1982
$201 bnvs$205 bn
India vs China, current US$
Size of the economy, 2004
$0.7 tnvs$2.0 tn
India vs China
China’s income per person, multiple of India’s
1.2×→3.5×
1982 to 2004
In 1982 India and China had economies of almost exactly the same size, about $200 billion each. Twenty-two years later China’s was nearly three times as large. The gap opened in schools, clinics and factories before it opened in GDP.
The split
Neck and neck until the mid-1980s, then China pulled away
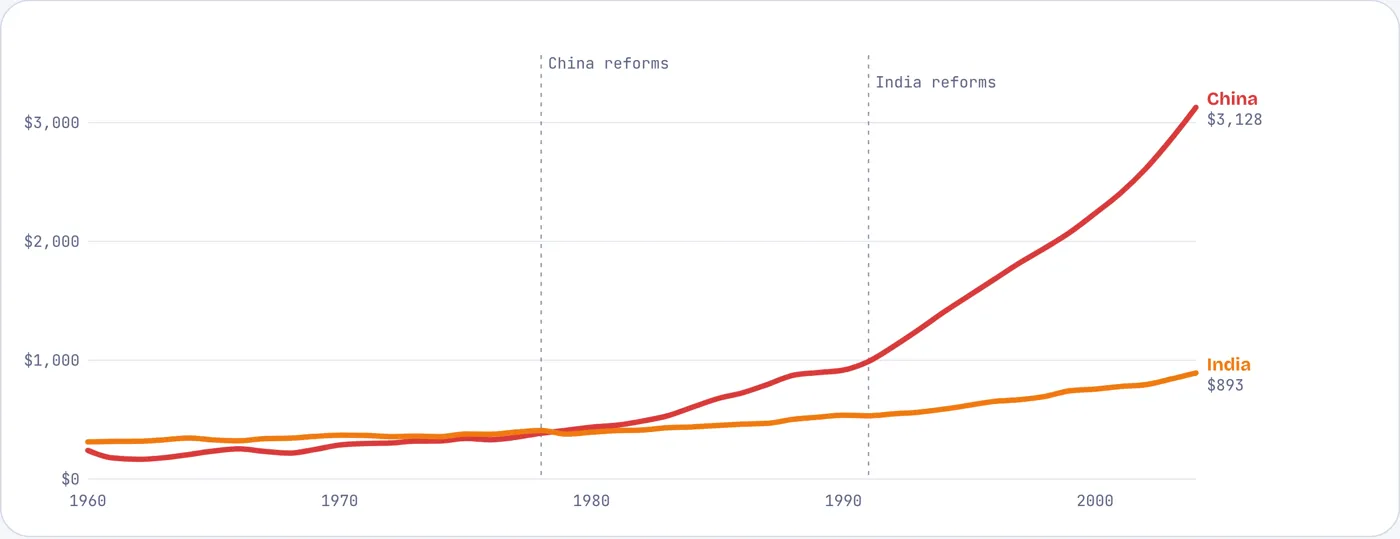
GDP per person, constant 2015 US$, 1960–2004. Tap or hover a line.
China began reforming in 1978, India in earnest in 1991. Through the early 1980s their incomes per person were within a fifth of each other. From 1982 to 2004 China’s grew 8.8% a year and India’s 3.6%: China’s more than sextupled, while India’s roughly doubled.
Source: World Bank WDI (NY.GDP.PCAP.KD).
The head start
China entered the race with healthier, more literate, smaller families
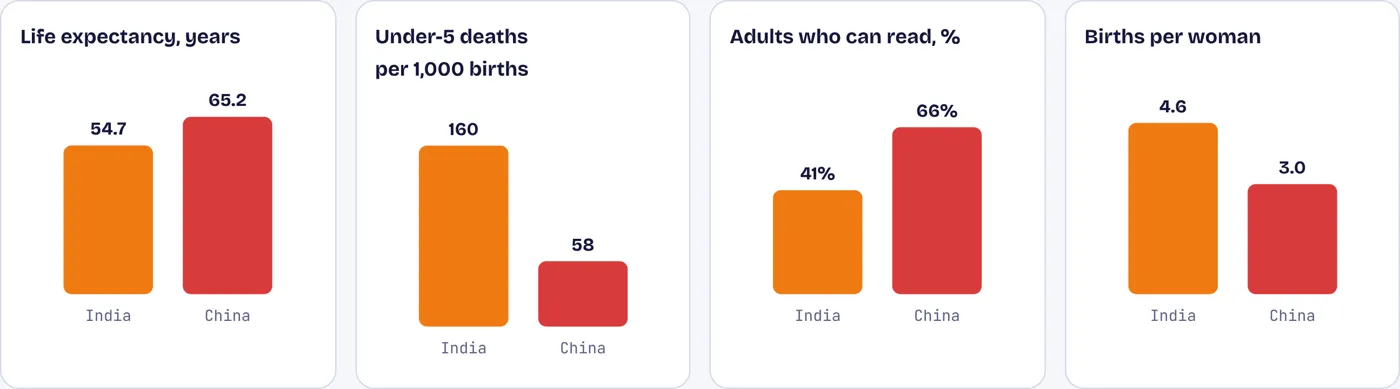
India vs China, early 1980s (1981 for India’s literacy)
Whatever else it did, the Mao era left China with a workforce that lived ten years longer and was far more often literate than India’s. A Chinese child was a third as likely to die before five. When factories arrived, China had the workers ready to staff them.
Source: World Bank WDI (life expectancy, under-5 mortality, adult literacy, fertility).
The engine
China invested a far larger share of its income, every year
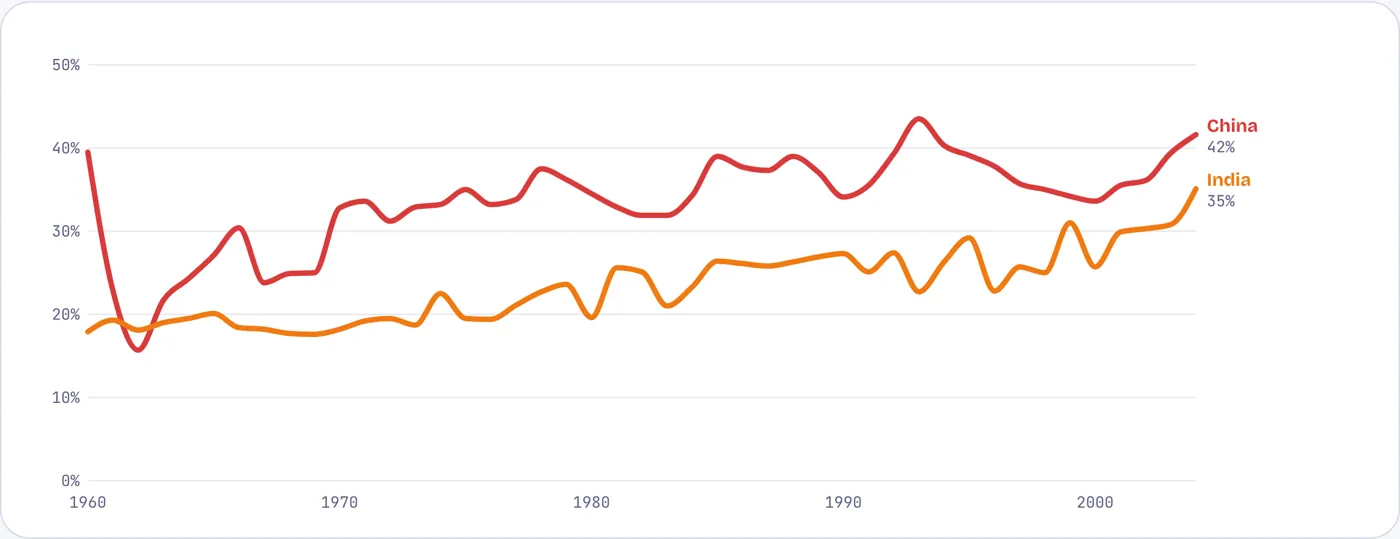
Gross capital formation, % of GDP, 1960–2004
From 1982 to 2004 China put on average 37% of its GDP into roads, plants and buildings; India put 27%. India’s rate rose to 35% only in 2004. Ten points of GDP more each year, for two decades, compounds into a different country.
Source: World Bank WDI (NE.GDI.TOTL.ZS).
Selling to the world
China’s share of world exports rose fivefold; India’s barely moved
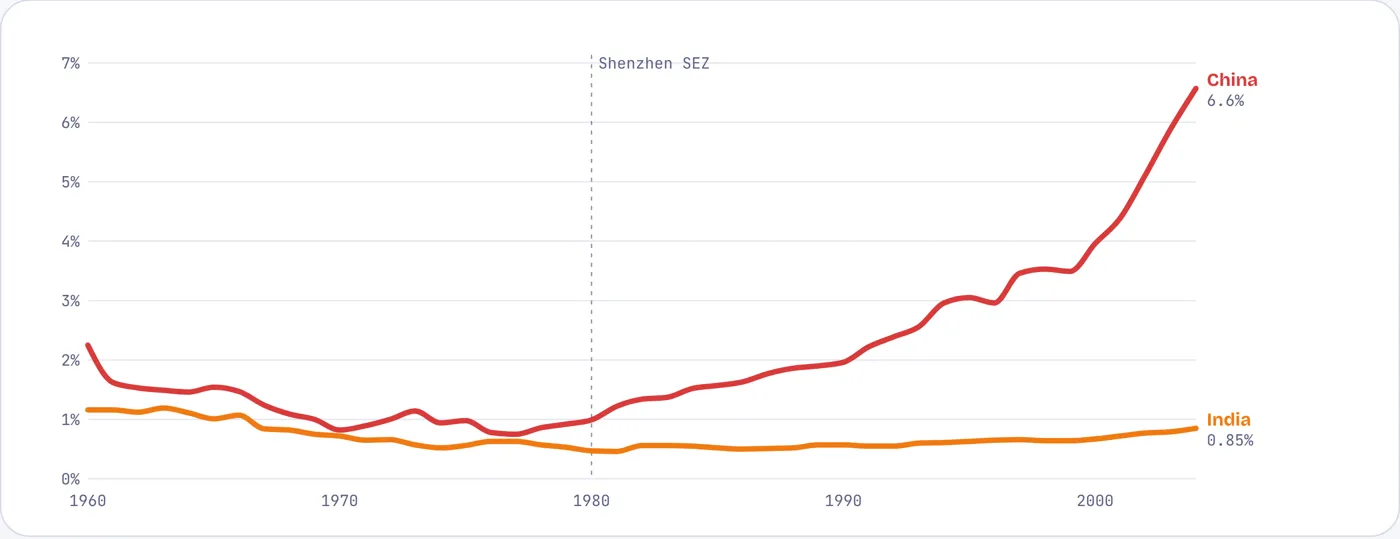
Share of world merchandise exports, %, 1960–2004
Special economic zones such as Shenzhen, opened in 1980, pulled in foreign firms that used cheap, literate labour to assemble goods for export. China went from 1.3% of world goods exports in 1982 to 6.6% in 2004. India went from 0.6% to 0.85%.
Source: World Bank WDI (TX.VAL.MRCH.CD.WT); world total summed over reporting countries.
Foreign capital
Foreign investment flowed to China a dozen times faster
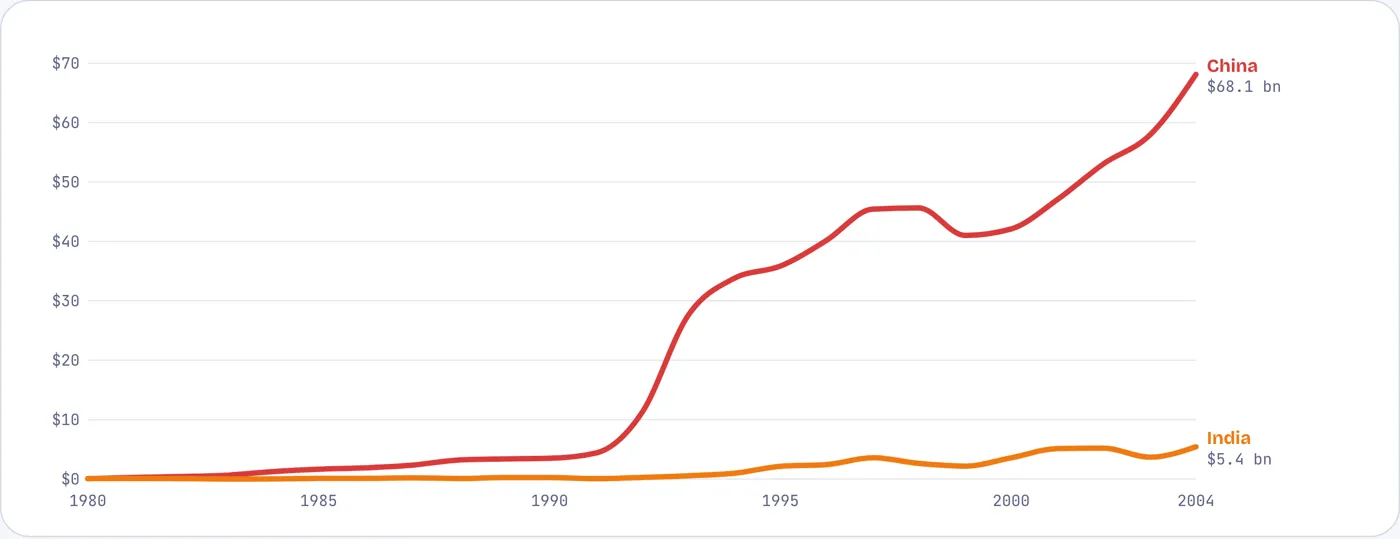
Net inflows of foreign direct investment, US$ billion, 1980–2004
By 2004 China was receiving $68 billion a year of foreign direct investment, India $5 billion. Much of China’s came from Hong Kong and Taiwan, bringing technology, managers and export contacts along with money.
Source: World Bank WDI (BX.KLT.DINV.CD.WD).
The payoff
China cut extreme poverty from almost everyone to a third; India from half to under half
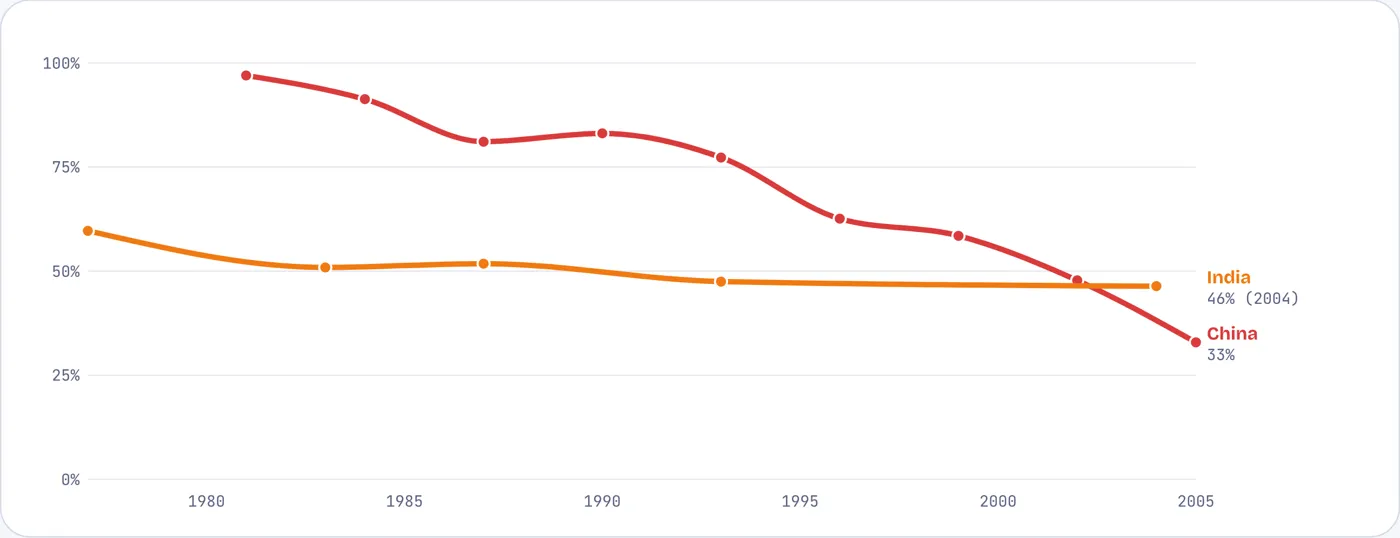
Share of people living on under $3 a day (2021 PPP), %, survey years
In 1981, 97% of Chinese lived below the line; by 2005, 33%. India started far better off, at 51% in 1983, but was still at 46% in 2004. Factory jobs in coastal China did what two decades of steady but farm-bound growth in India did not.
Source: World Bank Poverty and Inequality Platform, via WDI (SI.POV.DDAY).
Contested numbers
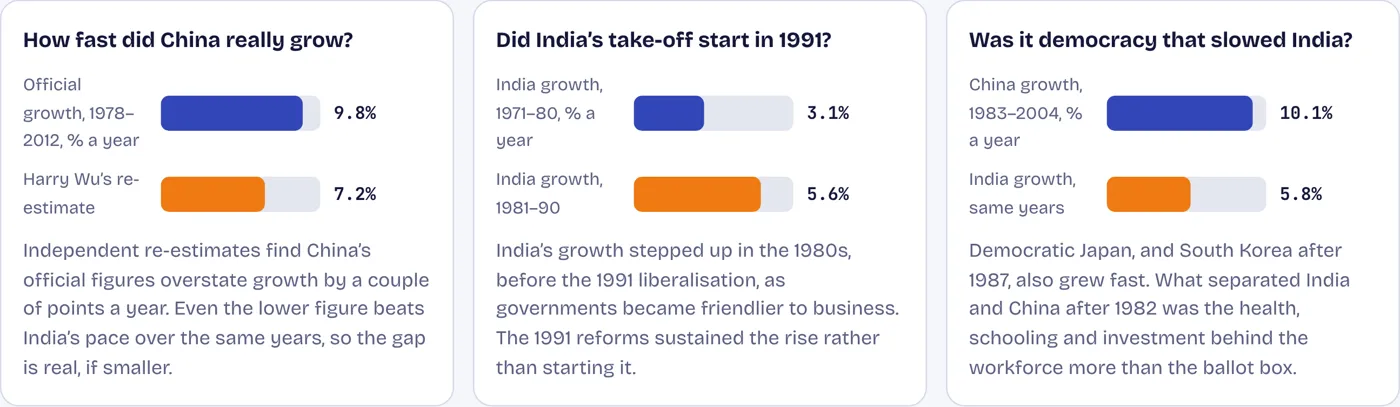
Three numbers that need a second look
Source: Conference Board (Harry Wu); Rodrik and Subramanian (2004); World Bank WDI.
The takeaway
India and China started the 1980s level on income. China pulled ahead by putting healthier, literate workers into factories built with high investment and foreign capital; India grew respectably but kept its workers on farms.