The size gap
China added more than four Indias
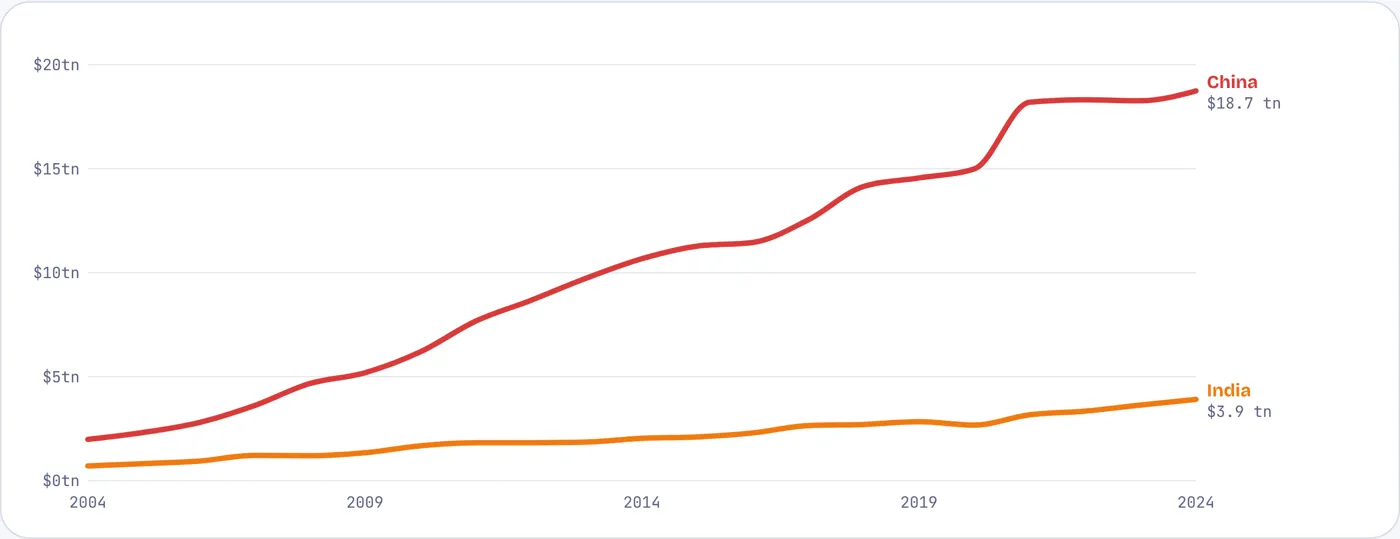
GDP, current US$ trillion, 2004–2024. Tap or hover a line.
India’s economy grew five and a half times in twenty years, to $3.9 trillion. China’s grew from $2.0 trillion to $18.7 trillion: the increase alone is more than four Indias. India has grown faster since 2021 and the ratio has slipped from its 2021 peak of 5.8, but the gap in dollars has not yet begun to close.
Source: World Bank WDI (NY.GDP.MKTP.CD).
The workshop of the world
China makes three of every ten manufactured goods; India makes three in a hundred
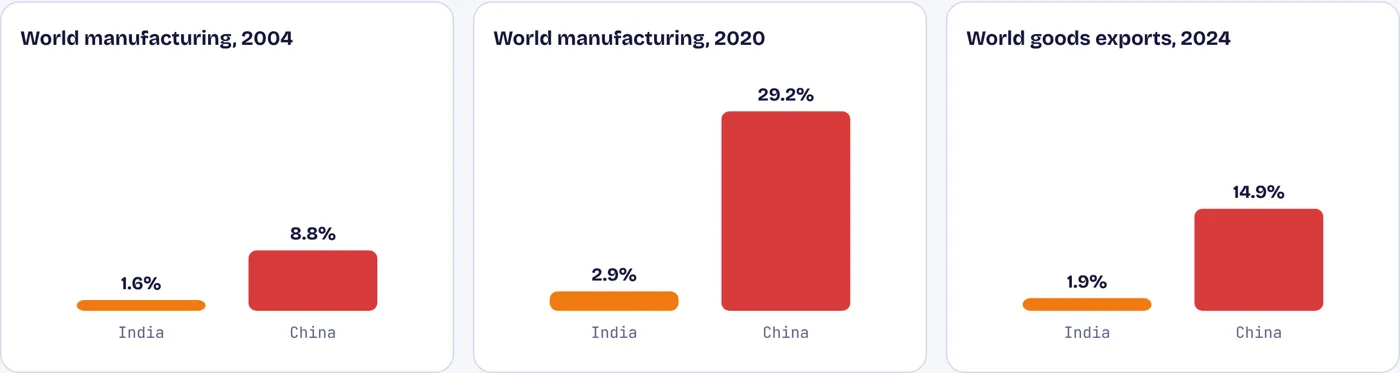
Share of world manufacturing value added, %, 2004 and 2020; share of world goods exports, %, 2024
China’s share of world manufacturing more than tripled to 29%; India’s rose from 1.6% to 2.9%. China sells 15% of the world’s goods exports, India under 2%. Factories are where farm workers in China found better-paid jobs.
Source: World Bank WDI (NV.IND.MANF.CD, TX.VAL.MRCH.CD.WT); world totals summed over reporting countries.
Leaving the farm
China halved the share of its workers on farms; India cut it by a quarter
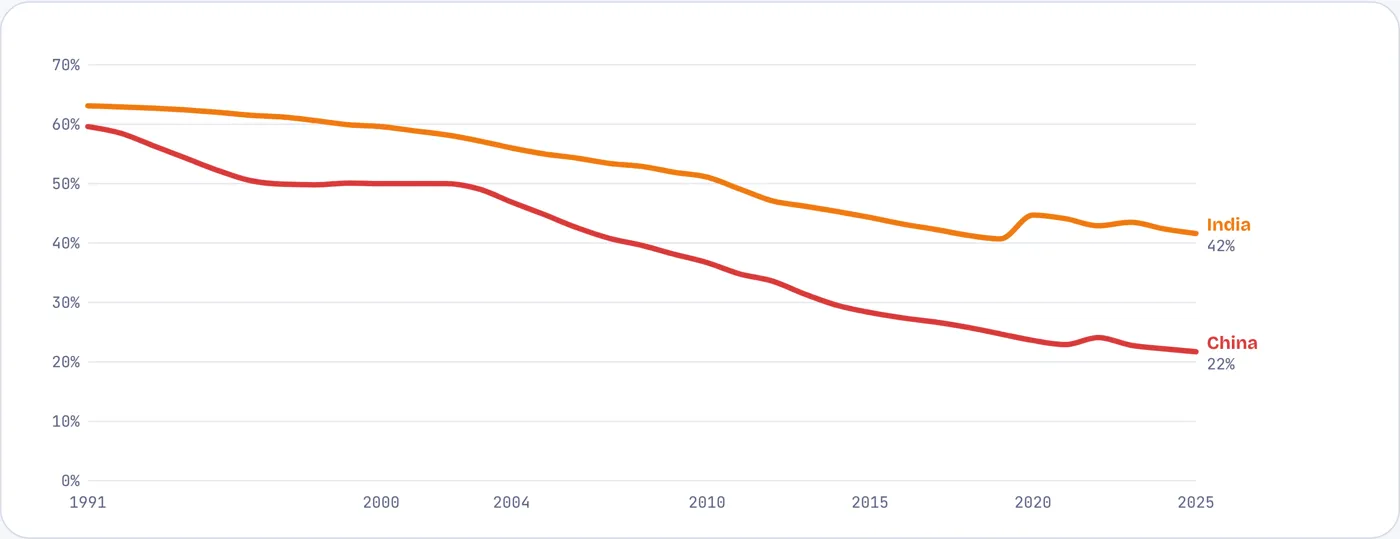
Employment in agriculture, % of all workers, 1991–2025 (ILO modelled estimates)
In 2004 about half of both countries’ workers were on farms. China is now at 22%, India at 42%, and India’s share rose during the pandemic as workers returned to villages. Farm work is where productivity, and pay, are lowest.
Source: ILO modelled estimates via World Bank WDI (SL.AGR.EMPL.ZS).
Where India caught up
Both countries all but ended extreme poverty, China a decade earlier
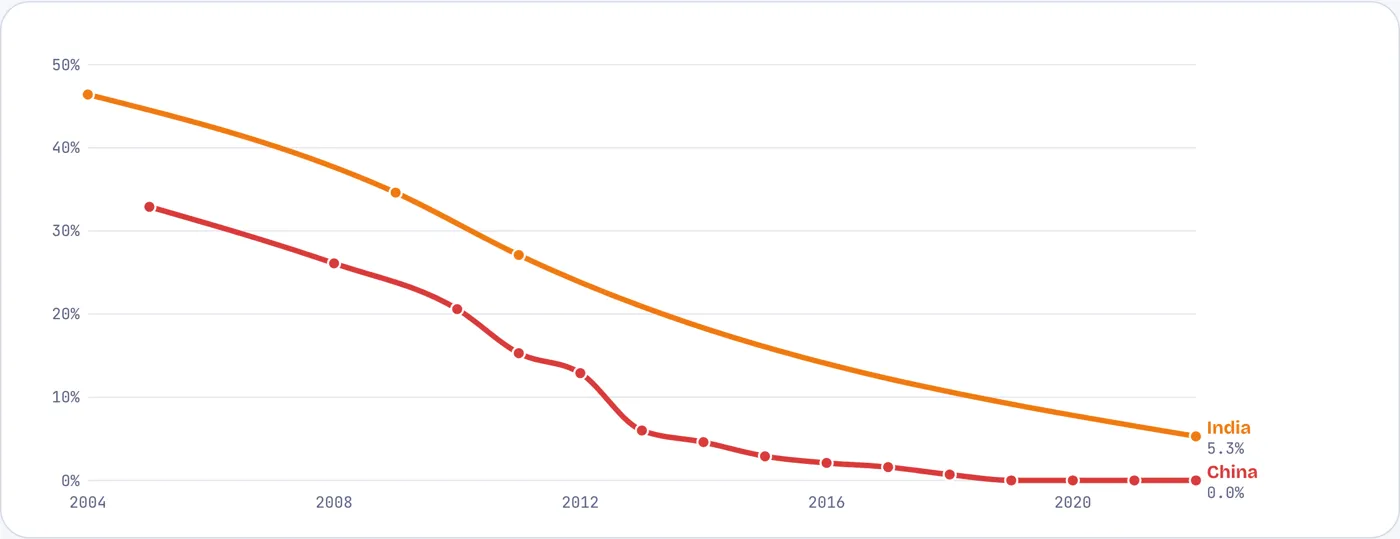
Share of people living on under $3 a day (2021 PPP), %, survey years, 2004–2022
This is India’s strongest result against China. Extreme poverty fell from 46% to 5.3% between 2004 and 2022, a fall similar to China’s from 2005 to 2014. China reached zero on this line by 2019.
Source: World Bank Poverty and Inequality Platform, via WDI (SI.POV.DDAY).
Where India did not
On health, women’s work, universities and research, the gaps are still wide
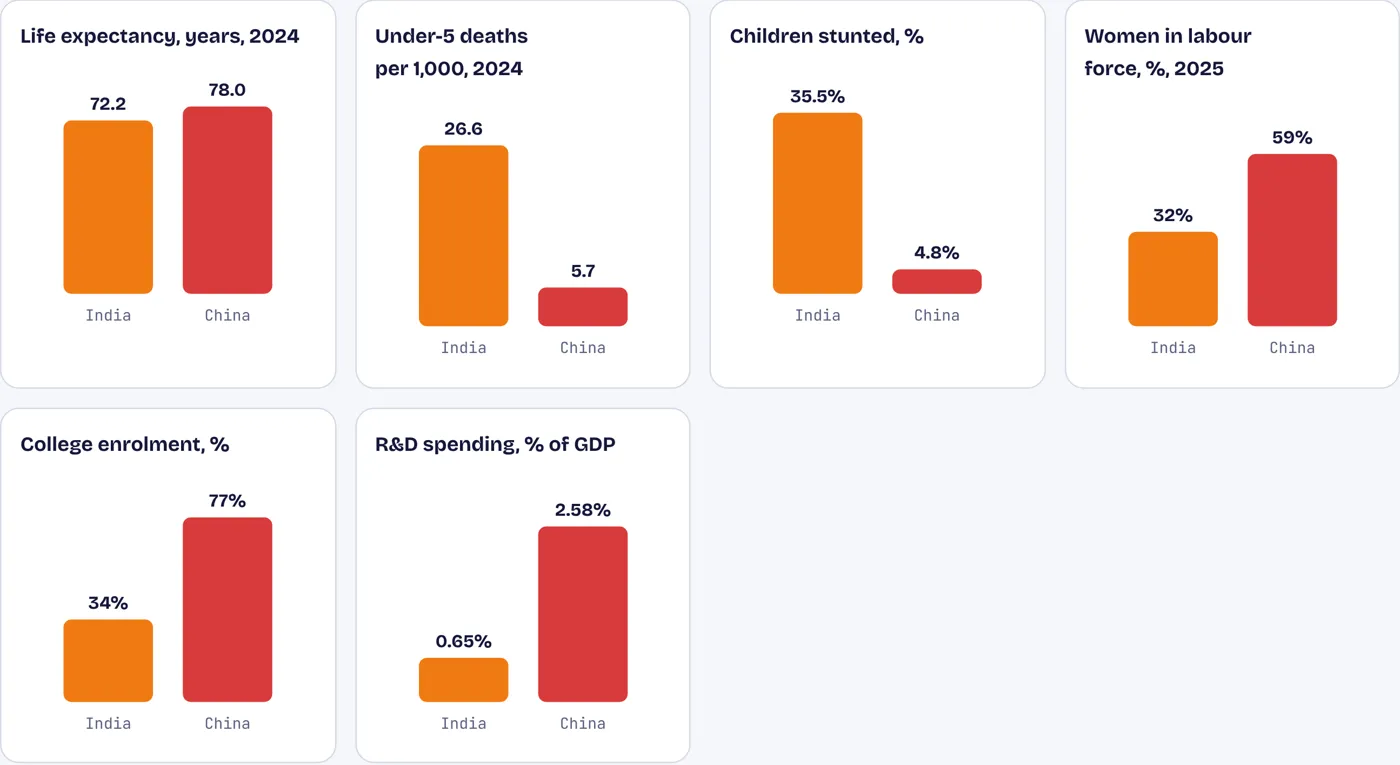
India vs China, latest year
A child in India is nearly five times as likely to die before five as one in China, and seven times as likely to be stunted. Six in ten Chinese women are in the labour force against three in ten Indian women. China sends three quarters of young people to college and spends four times India’s share of GDP on research.
Source: World Bank WDI; stunting 2020 for India, 2017 for China; R&D 2020 for India, 2023 for China.
Power for growth
The average Chinese uses five times as much electricity as the average Indian
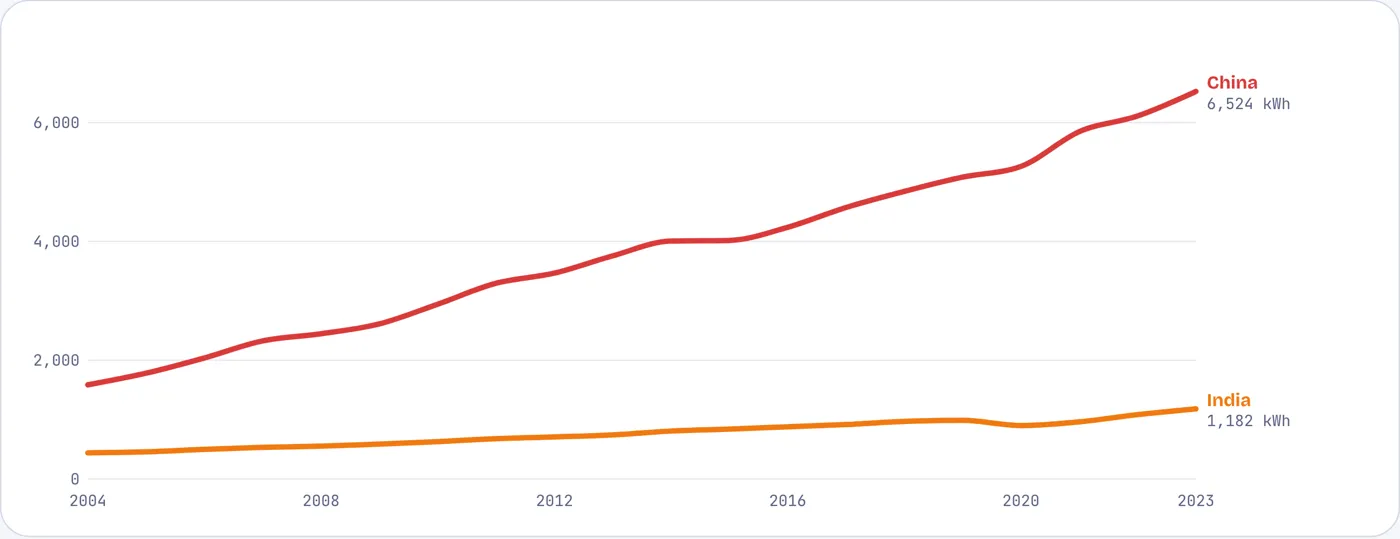
Electricity consumption, kWh per person, 2004–2023
Electricity use tracks factories, air conditioning and appliances. India nearly tripled its consumption per person, but China quadrupled from a higher base. India’s 2023 level is below China’s in 2004.
Source: World Bank WDI (EG.USE.ELEC.KH.PC).
Cleaner air
China cut fine-particle pollution by a third in six years; India’s fell less
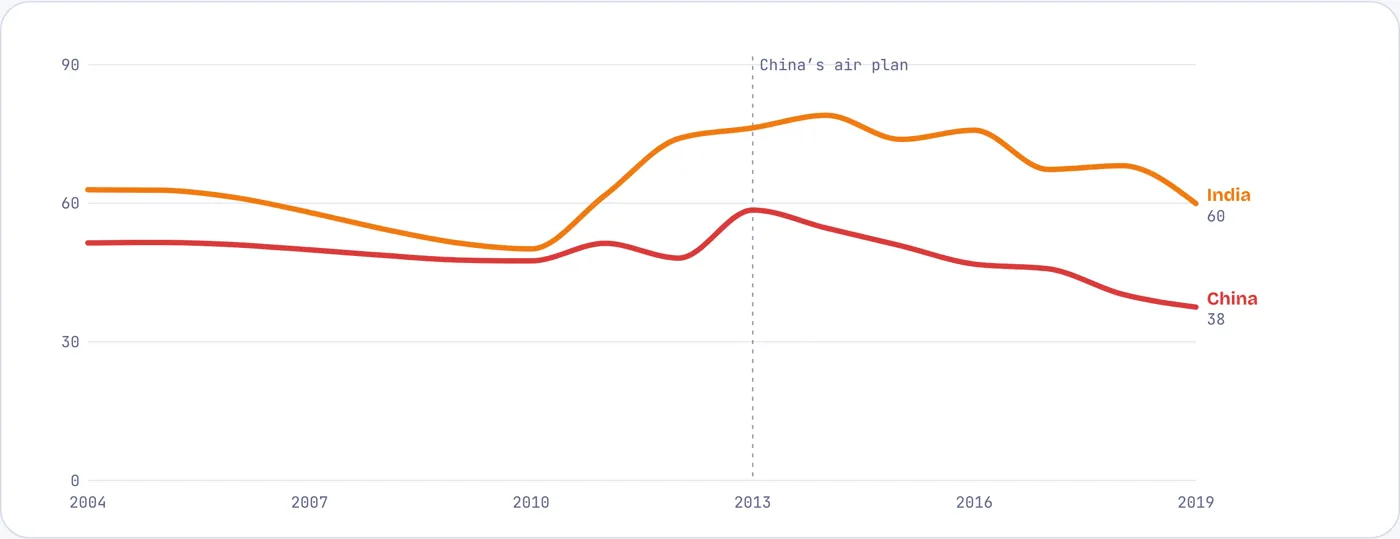
Mean annual exposure to PM2.5, µg/m³, 2004–2019 (WHO guideline: 5)
After record smog in 2013, Beijing ordered coal plants shut, factories moved and heating switched to gas. Average exposure fell from 58 to 38 µg/m³ by 2019. India’s fell from 76 to 60 over the same years and remains among the highest in the world.
Source: World Bank WDI, modelled estimates (EN.ATM.PM25.MC.M3).
The turn
India now attracts more foreign investment, is younger and is free to argue
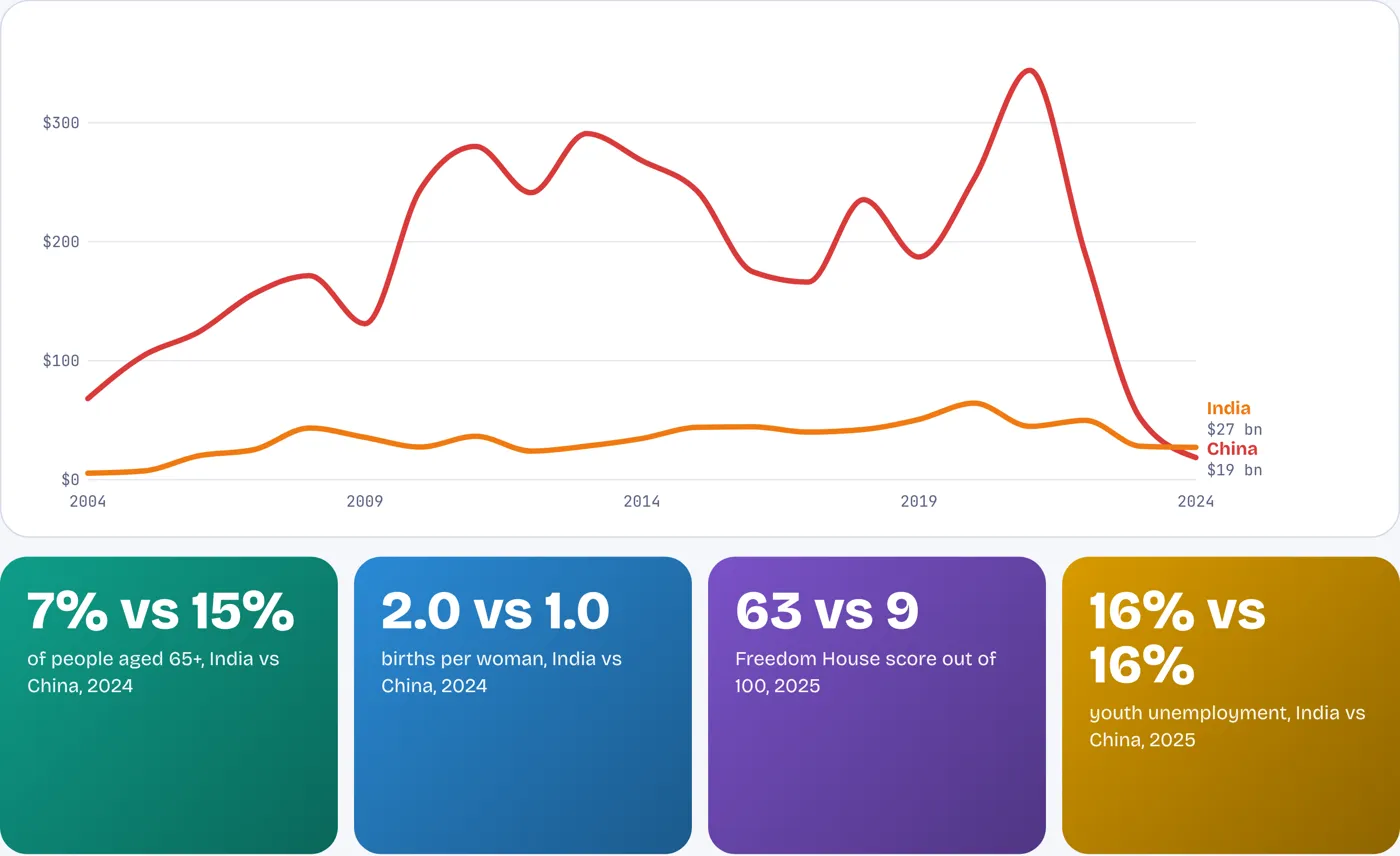
Net foreign direct investment inflows, US$ billion, 2004–2024; tiles show 2024–25 values
China’s foreign investment inflows collapsed after 2021 amid trade tensions; in 2024 India received more. China has begun to age before getting rich, with one person in seven over 65 and one birth per woman. India has a younger workforce and a free press and elections, which give it a way to correct course that China lacks.
Source: World Bank WDI (FDI, age, fertility); Freedom House, Freedom in the World 2025.
Contested numbers
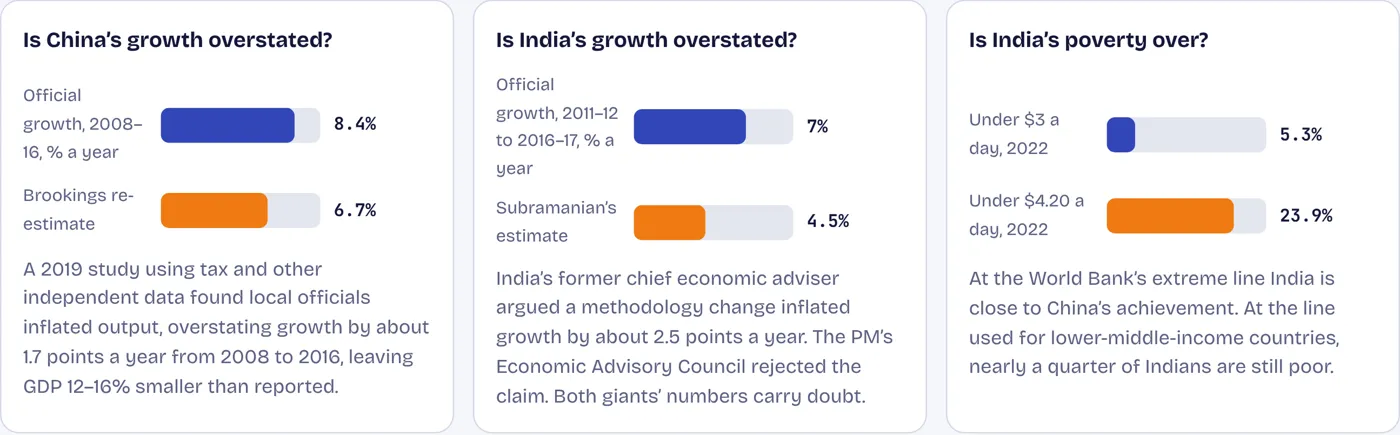
Three numbers that need a second look
Source: Brookings Papers on Economic Activity (2019); Arvind Subramanian (2019); World Bank WDI.