A citizen experience index
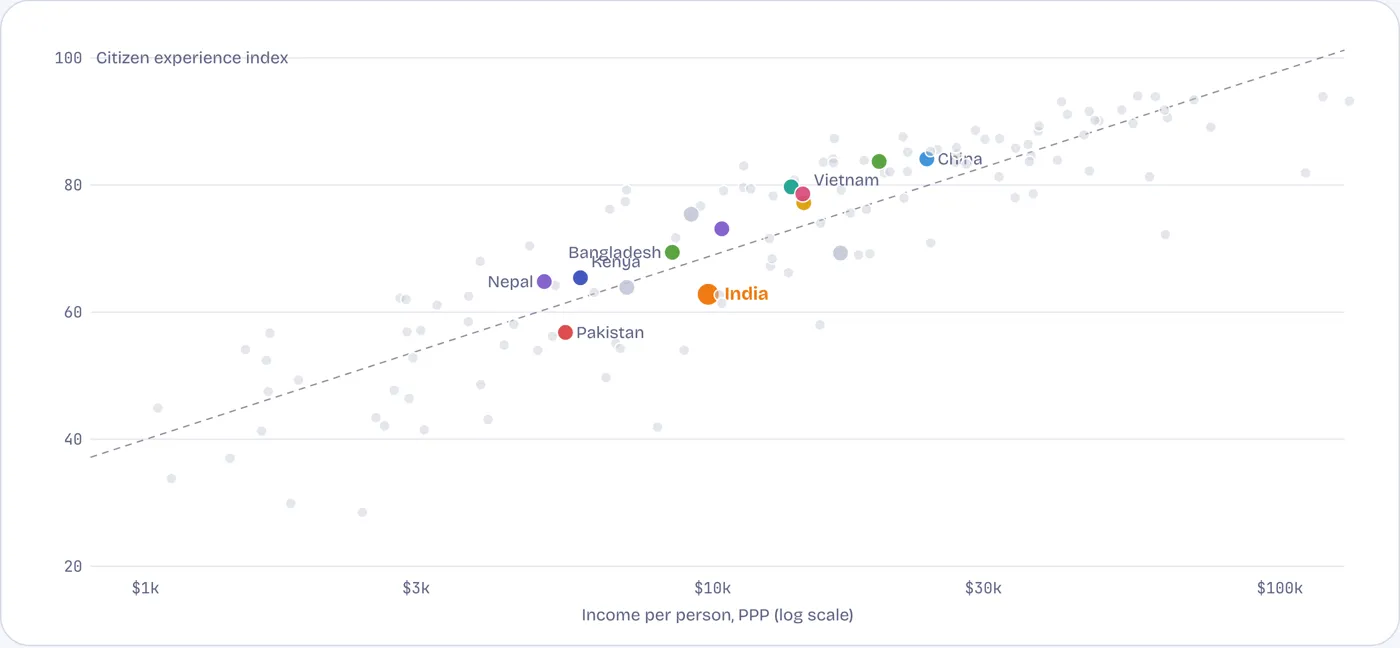
On what citizens actually live with, India ranks 16 places below its income
A simple index of eight everyday outcomes (0–100) against income per person, 137 countries, latest data. Tap or hover a dot.
The index averages eight things a citizen feels directly: a long life, children who survive and grow, clean air, safe water, safe roads, women able to work, and power at home. India ranks 94th of 137 on it, against 78th on income. Kenya, Nepal and Ghana, all poorer, score higher; so does Bangladesh at a similar income. A published index of this kind, every year, would show voters whether growth is reaching them.
Source: Calculated from World Bank WDI and WHO estimates, latest year 2015–2024 for each measure; each scaled 0–100 across countries with over a million people and averaged with equal weights. An illustration of the method, not an official index.
Inside the index
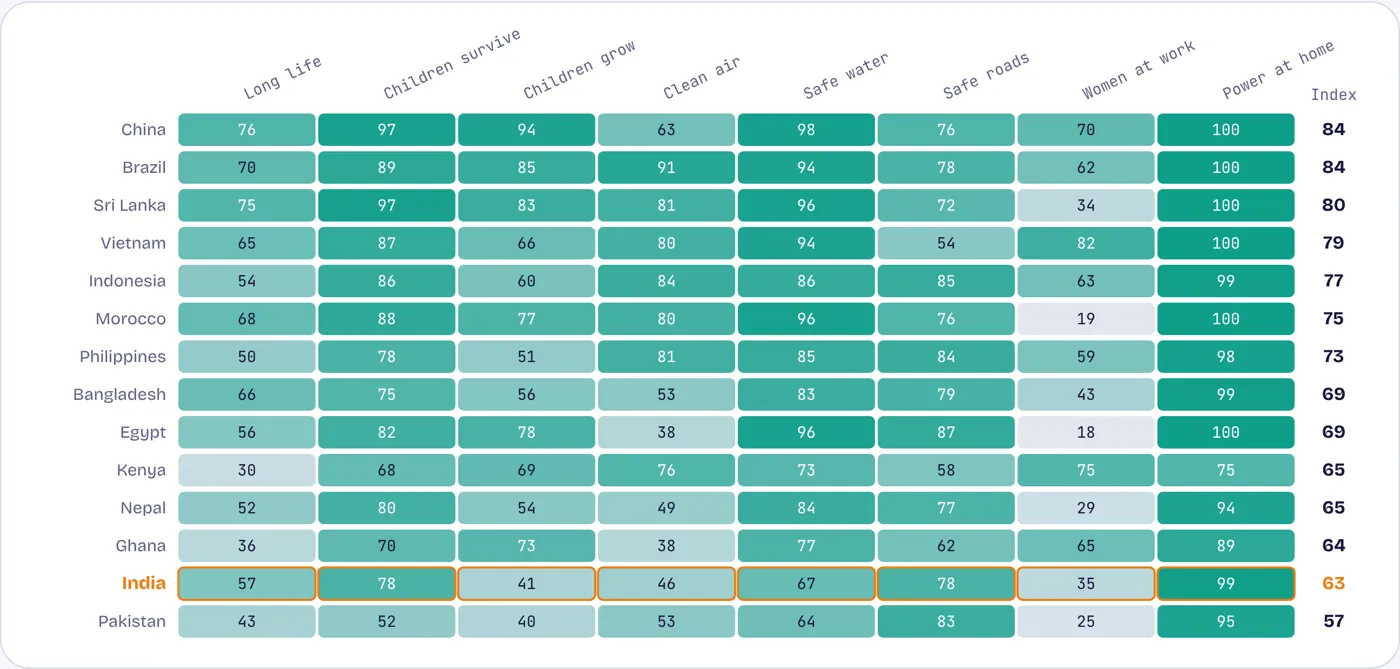
India scores well on power at home and roads per person; poorly on children’s growth, air and women’s work
Scores on the eight measures (0–100), India and peers. Darker is better. Tap or hover a cell.
The grid separates what India has fixed from what it has not. Electricity is near universal. Children’s height, clean air, safe water and women’s work are where India scores among the lowest in the panel, the same gaps the earlier chapters found one by one.
Source: As above.
The statistical system
India’s statisticians are capable; the institutions around them are weak
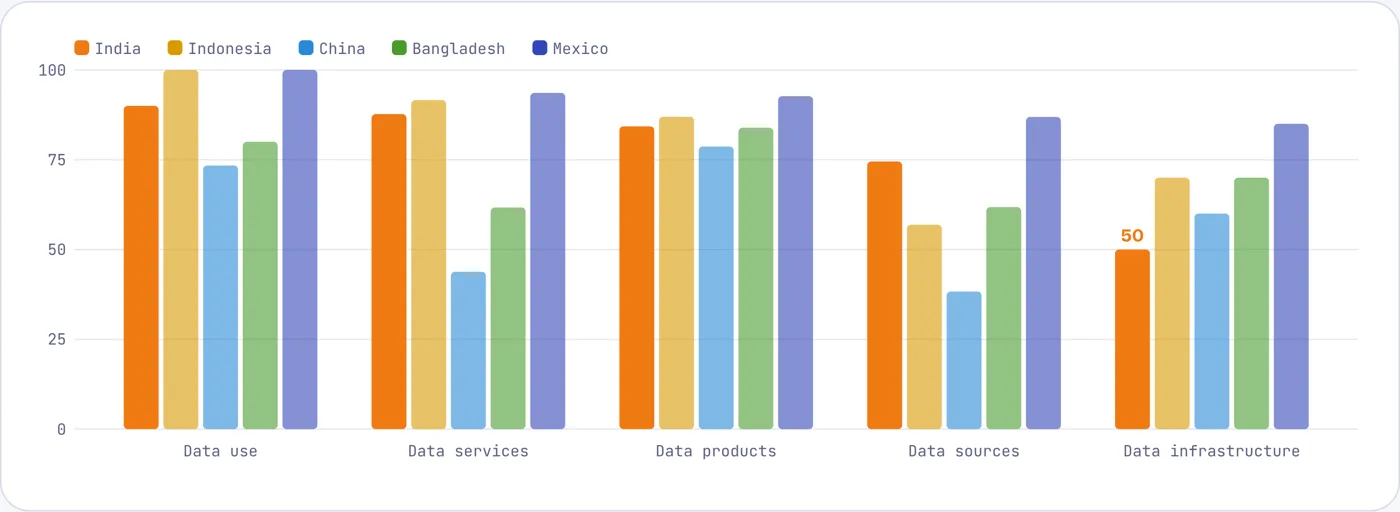
World Bank Statistical Performance Indicators, 2023: score by pillar (0–100)
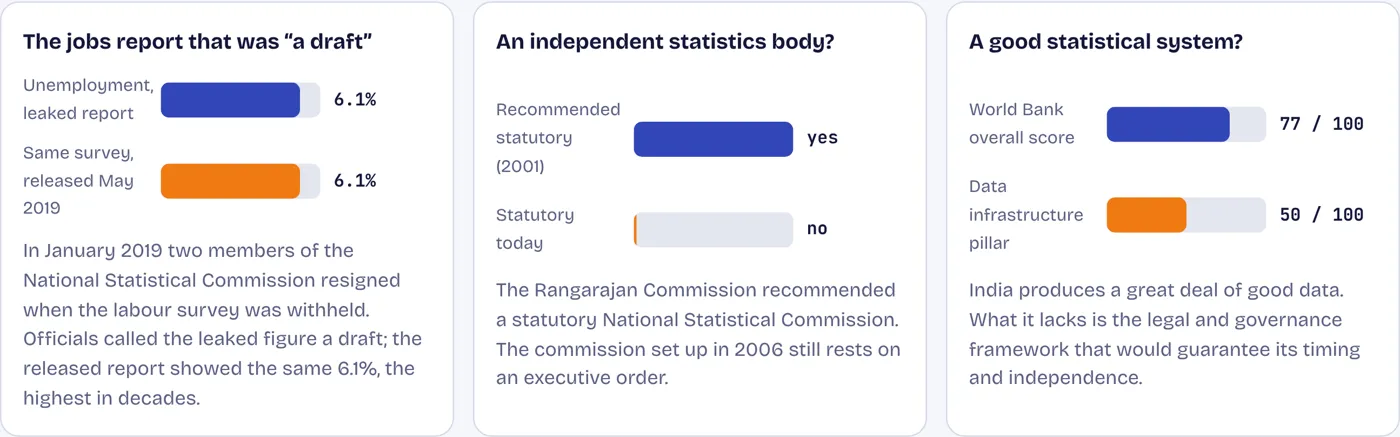
On the World Bank’s measures, India’s data production and use score well, above China and close to Indonesia. Its weakest pillar is data infrastructure: legislation, governance, standards and funding, where India scores 50 against 70 for Indonesia and Bangladesh and 85 for Mexico. The National Statistical Commission, set up in 2006, still has no statutory basis.
Source: World Bank Statistical Performance Indicators, via WDI. Pillars: data use, data services, data products, data sources, data infrastructure.
How old is the evidence?
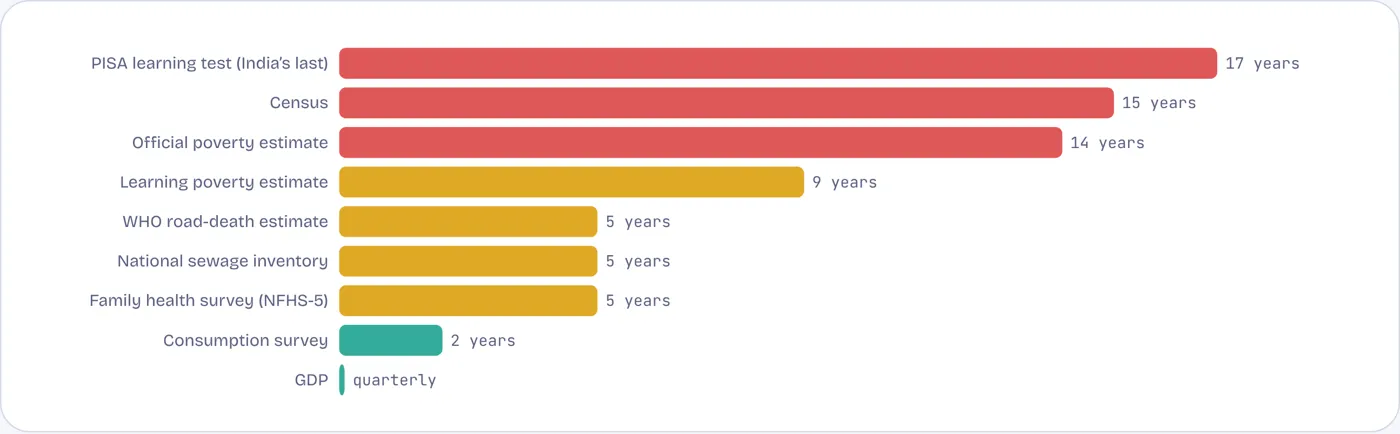
Several of India’s key numbers are five to seventeen years old
Years since the latest national measurement, as of 2026
India’s quarterly GDP figures are a day old by comparison. The numbers that describe citizens’ lives, how many people there are, how many are poor, how many children can read, how sewage and roads are faring, are years old, and several are produced only once and then not repeated.
Source: Registrar General of India; MoSPI; NFHS; World Bank learning poverty; CPCB; WHO; OECD PISA.
Four institutions
What honest numbers would need
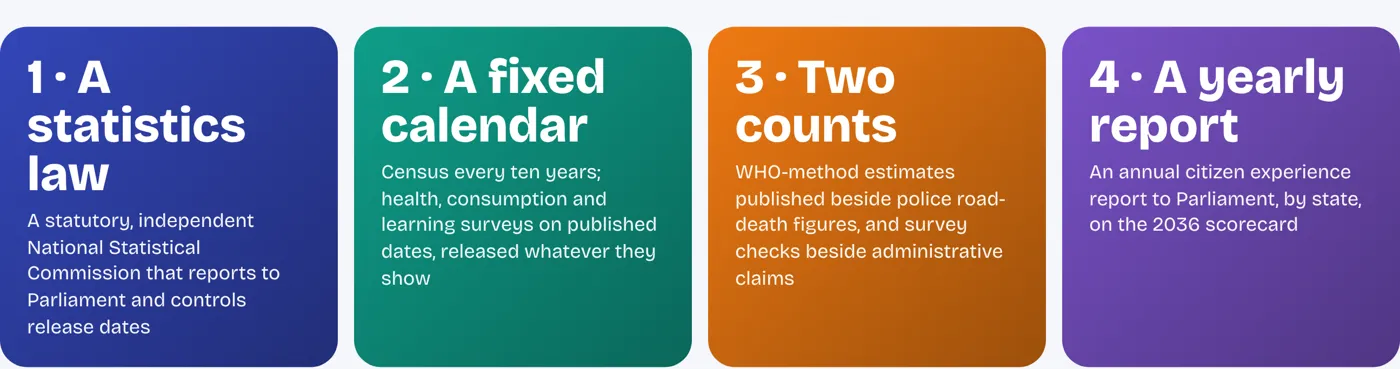
None of these is novel. Many democracies give their statistics offices legal independence and publish release calendars in advance. India’s own Rangarajan Commission recommended a statutory statistics body in 2001.
Source: Proposals; Rangarajan Commission on Statistics (2001); World Bank SPI.
The 2036 scorecard
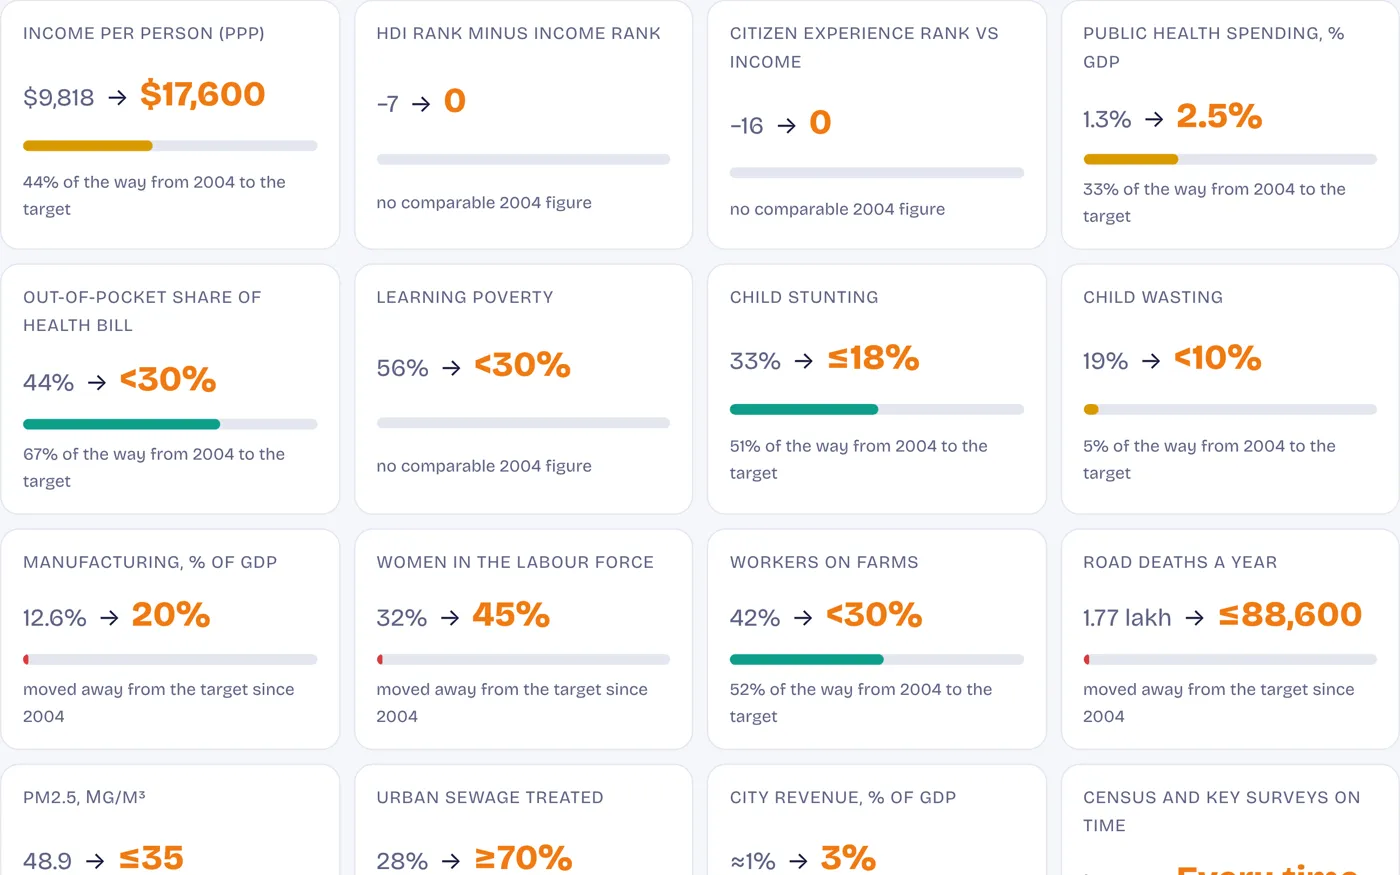
Sixteen numbers voters can check
Proposed targets from the five chapters of Part VII: today’s value, the 2036 target, and how far today’s value is along the way.
Source: Targets proposed here, anchored on peers, WHO and UN benchmarks, and India’s own past commitments. Bars show how far India has moved since 2004 towards each target, where a comparable 2004 figure exists; red means it has moved away.
Contested numbers
Three numbers that need a second look
Source: IndiaSpend / iSignal interview with P C Mohanan; Business Standard (2019); World Bank SPI.